
University of the Pacific: endowment and investment office
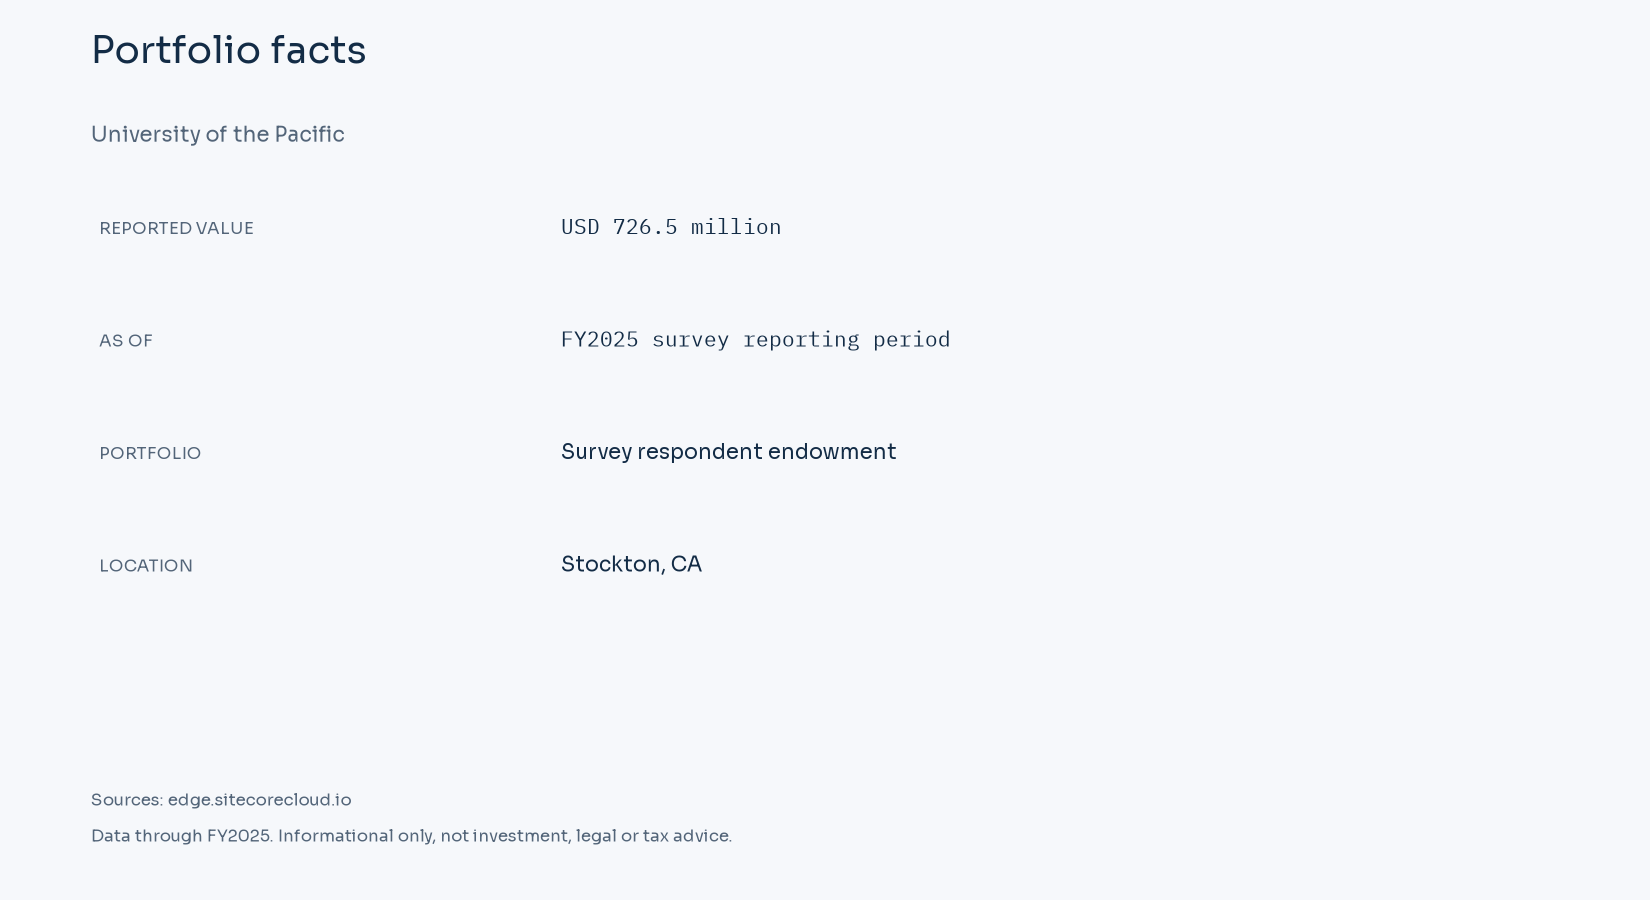
The FY2025 NACUBO table lists University of the Pacific at USD 726.5 million in respondent endowment assets. Balance source
Pacific's FY2025 statements distinguish endowment net assets from the university's wider investment holdings. Donor restrictions determine how endowed accounts are classified. The separately published institutional overview gives an approximate $832 million endowment as of May 2026, but that milestone lacks a stated fiscal-year closing date and is kept separate from the common-year survey balance. Official report
Key facts
- Reported value
- USD 726.5 million
- As of
- FY2025 survey reporting period
- Portfolio
- Survey respondent endowment
- Location
- Stockton, CA
Endowment size and reporting scope
At USD 726.502 million, University of the Pacific's survey balance measures assets at a reporting date. The prior-year observation is USD 643.177 million. Neither amount measures unrestricted operating cash. A fund's donor purpose can limit spending even when its investments participate in a common pool. Survey scope and definitions
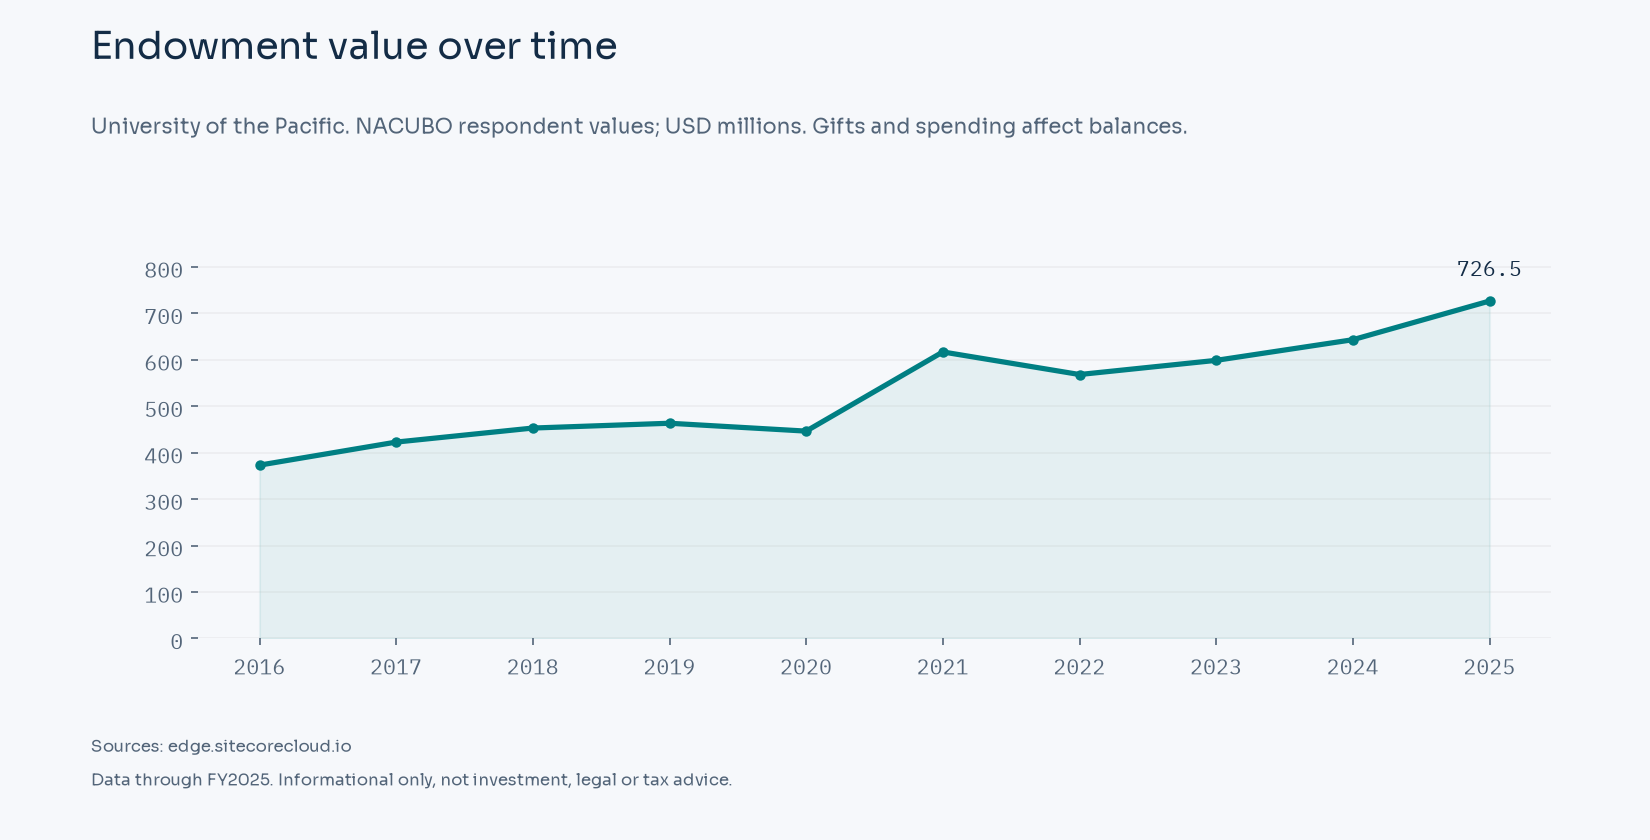
| Fiscal year | Survey endowment, USD millions |
|---|---|
| FY2016 | 373.101 |
| FY2017 | 422.744 |
| FY2018 | 452.976 |
| FY2019 | 463.313 |
| FY2020 | 446.357 |
| FY2021 | 616.854 |
| FY2022 | 568.233 |
| FY2023 | 598.744 |
| FY2024 | 643.177 |
| FY2025 | 726.502 |
The FY2025 survey value for University of the Pacific is USD 726.502 million, compared with USD 643.177 million for FY2024. The USD 83.325 million movement is 12.96% of the earlier balance. It includes changes in investments as well as additions and distributions. NACUBO explicitly distinguishes this change in market value from an investment rate of return. FY2025 respondent values and definitions
The available history begins in FY2016 at USD 373.101 million and ends in FY2025 at USD 726.502 million. The change across those observations is USD 353.401 million. The smallest reported balance in the displayed series is USD 373.101 million in FY2016; the largest is USD 726.502 million in FY2025. These are closing asset values. They do not show how much of a year's movement came from new gifts, spending or investment results. NACUBO historical workbook
Spending policy and payout
The FY2025 NCSE $500M to $1B group reports an average effective spending rate of 4.3%. That is a survey-group statistic and is not assigned as University of the Pacific's policy. An institution's own spending rule can use several prior valuation dates, a prior-year dollar draw or additional adjustments. Its approved appropriation and the cash ultimately spent by a department can differ in timing. NCSE spending-rate table
For University of the Pacific, the USD 726.502 million survey balance does not disclose a dollar payout. The peer spending rate above describes other respondents in a common size group. It cannot identify this institution's approved draw or the purposes of distributions. Donor restrictions and the policy's averaging dates remain relevant to annual support. Spending measures
Governance and investment office
NACUBO classifies University of the Pacific as private college/university endowment or other non-profit institution. The Stockton, CA respondent is the unit used for its rank of 208. That category describes the reporting institution. Investment oversight and the legal ownership of supporting-fund assets require the institution's own governing documents, with the university and any separately incorporated foundation identified individually. Investment governance
Federal excise tax on investment income
Public Law 119-21 changed Section 4968 for tax years beginning after December 31, 2025. Applicable private institutions must have at least 3,000 tuition-paying students in the preceding tax year, with more than half located in the United States, and student-adjusted endowment of at least $500,000. The rates are 1.4% from $500,000 through $750,000 per student, 4% above $750,000 through $2 million, and 8% above $2 million. Enacted law, Section 70415
An institution's tax tier requires its statutory asset base, eligible student count and related-organization treatment. The survey's closing market value does not supply that calculation. No institution-specific rate is assigned without an institutional disclosure. A campus's enrollment in a public fact sheet can differ from the daily-average, full-time-equivalent count required by the law.
Annual support and federal tax measure different flows. A 5% spending rule, where an institution uses one, does not imply a 5% income-tax rate. The law's student-adjusted asset measure excludes assets used directly for exempt purposes and incorporates related-organization rules. Individual tax treatment follows that statutory calculation and the institution's own circumstances.
FY2025 size-band comparison
The FY2025 survey value of USD 726.502 million places this respondent in the $500M to $1B band. The published band contains 74 respondents and USD 54.8 billion of aggregate assets. Its average five-year annualized net return is 10.7%, and its ten-year average is 7.8%. The size classification follows the survey-year balance even where an official disclosure on this page uses a later year or a different portfolio scope. NCSE size groups NCSE average net returns
| NCSE measure | FY2025 average |
|---|---|
| One-year net return | 10.8% |
| Five-year annualized net return | 10.7% |
| Ten-year annualized net return | 7.8% |
| Effective spending rate | 4.3% |
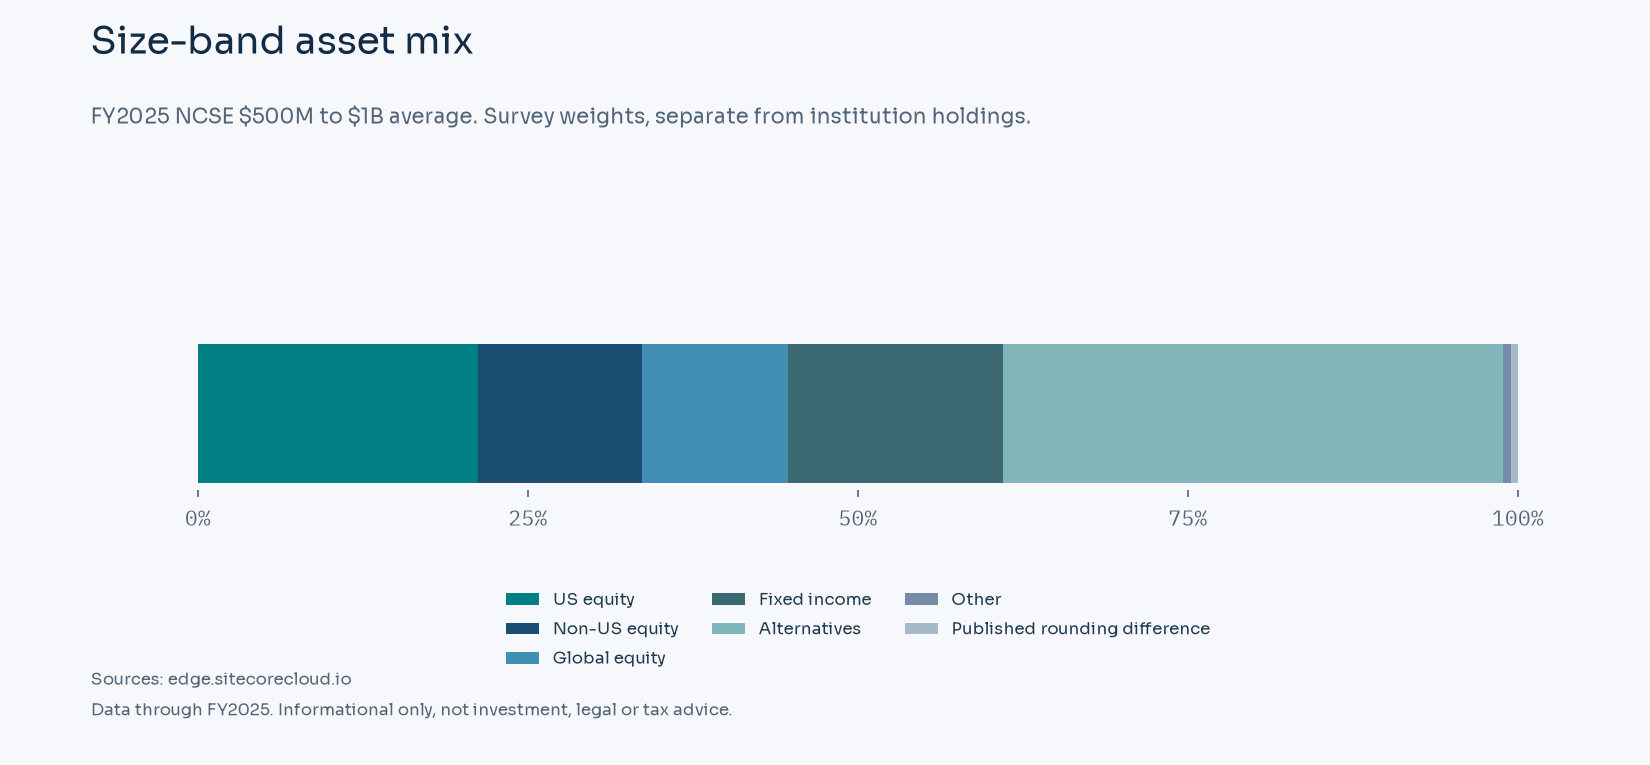
The peer mix describes average reported exposures within one size band. It does not reveal individual securities or the availability of cash at a particular institution. Respondents can also use different policy benchmarks. NCSE returns are net of external management fees and expenses for periods ending June 30, 2025; those periods and fee labels govern any numerical return comparison on this page. NCSE allocation definitions
Public records and reporting dates
The ProPublica nonprofit API identifies the legal filer as University Of The Pacific, EIN 941156266. Its available filing for the year ended June 30, 2023 reports total filer assets of USD 1,312.881 million, revenue of USD 488.744 million, expenses of USD 469.652 million. These are filer-wide amounts, which can include buildings, operating resources and other assets outside the endowment. The filing period is retained separately from the current investment disclosures. ProPublica structured filing data
Sources
- https://edge.sitecorecloud.io/nacubo1-nacubo-prd-dc8b/media/Nacubo/Documents/EndowmentFiles/2025-NCSE-Endowment-Market-Values-for-US-and-Canadian-Institutions-FINAL.xlsx
- https://www.pacific.edu/sites/default/files/users/user840/U_697372N-1A_UniversityofthePacific_FS.pdf
- https://edge.sitecorecloud.io/nacubo1-nacubo-prd-dc8b/media/Nacubo/Documents/research/Final-Endowment-Market-Values--2023-to-1974-Revised.xlsx
- https://edge.sitecorecloud.io/nacubo1-nacubo-prd-dc8b/media/Nacubo/Documents/EndowmentFiles/2025-NCSE-Public-Tables--Spending-Rates-FINAL.pdf
- https://www.congress.gov/119/plaws/publ21/PLAW-119publ21.pdf
- https://edge.sitecorecloud.io/nacubo1-nacubo-prd-dc8b/media/Nacubo/Documents/EndowmentFiles/2025-NCSE-Public-Tables--Number-of-NCSE-Participants-FINAL.pdf
- https://edge.sitecorecloud.io/nacubo1-nacubo-prd-dc8b/media/Nacubo/Documents/EndowmentFiles/2025-NCSE-Public-Tables--10-Year-Returns-by-Size-and-Type-FINAL.pdf
- https://edge.sitecorecloud.io/nacubo1-nacubo-prd-dc8b/media/Nacubo/Documents/EndowmentFiles/2025-NCSE-Public-Tables--Summary-Asset-Allocations-FINAL.pdf
- https://projects.propublica.org/nonprofits/api/v2/organizations/941156266.json
- https://www.pacific.edu/about-pacific
Related profiles
- Worcester Polytechnic Institute (USD 733.9 million)
- Yeshiva University (USD 714.2 million)
- Duquesne University (USD 640.9 million)
- Quinnipiac University (USD 744.8 million)
- College of the Ozarks (USD 703.7 million)
- Whitehead Institute for Biomedical Research (USD 750.3 million)