
Oakland University: endowment and investment office
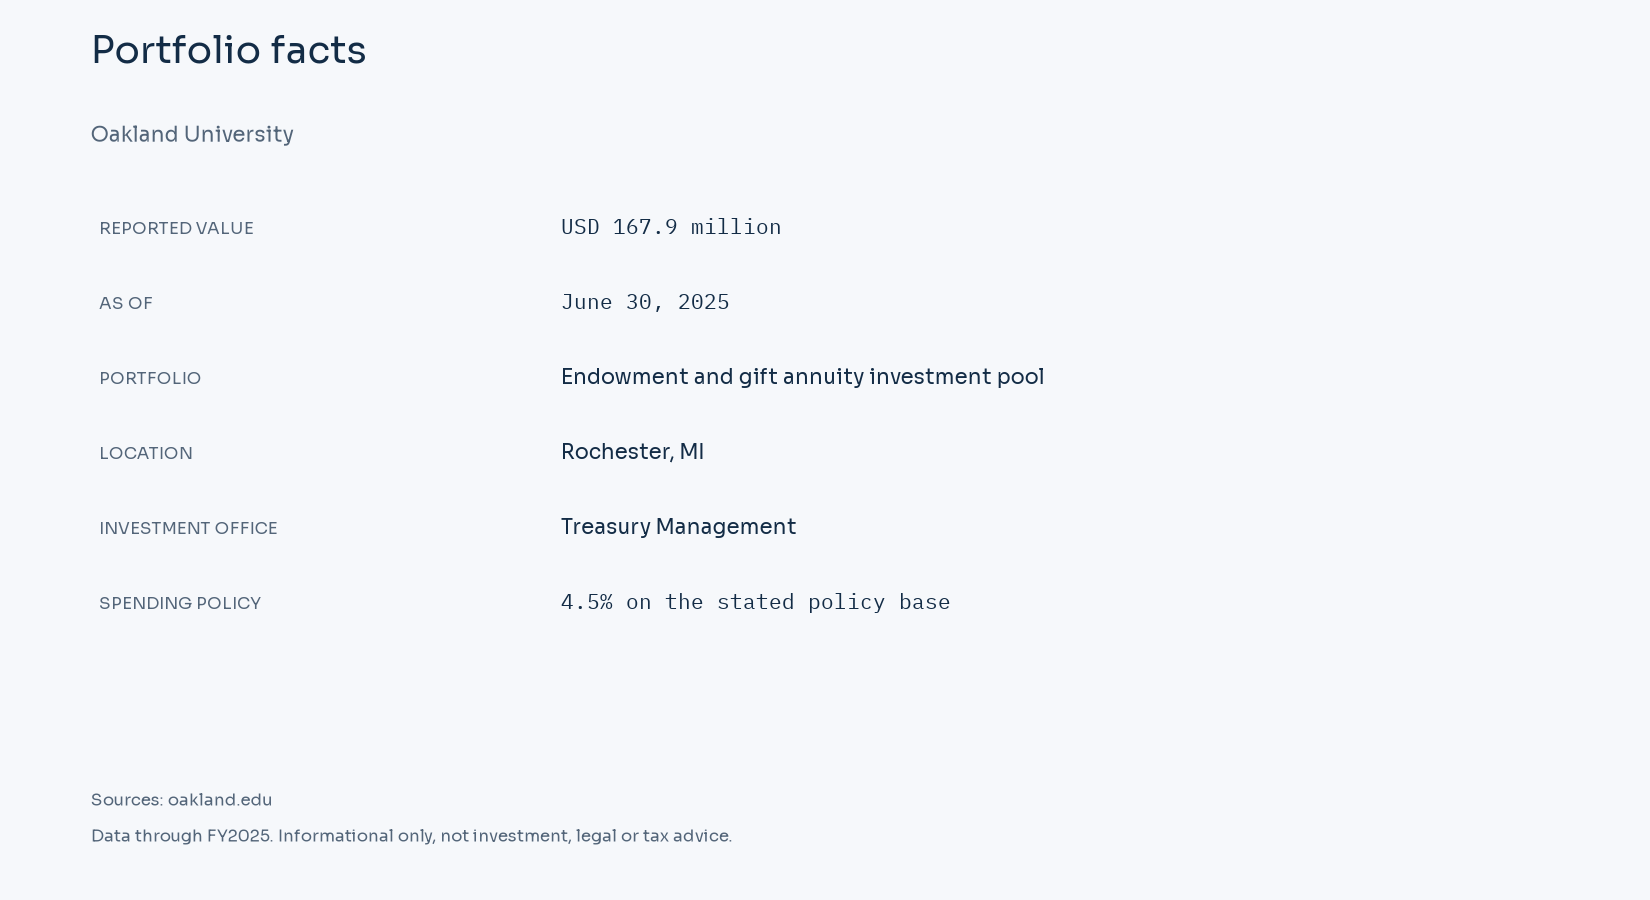
Oakland University reports USD 167.9 million in endowment and gift annuity pool market value for June 30, 2025. Balance source
Oakland's FY2025 endowment page reports $167.858415 million at June 30, 2025. Its definition aggregates separate endowment and gift annuity funds, while each beneficiary fund is administered separately. The page reports $4.617870 million donated to endowment funds and $4.080273 million distributed for their purposes. Actual portfolio weights are published alongside annualized investment performance. Official report
Key facts
- Reported value
- USD 167.9 million
- As of
- June 30, 2025
- Portfolio
- Endowment and gift annuity investment pool
- Location
- Rochester, MI
- Investment office
- Treasury Management
- Spending policy
- 4.5% on the stated policy base
Endowment size and reporting scope
The USD 166.402 million survey balance belongs to the respondent named Oakland University. Donor-restricted resources can be invested beside funds designated by the governing board for long-term use. Each account retains its purpose and beneficiary. A pooled vehicle can also include reserves or other long-term money, which gives its market value a different scope from endowed net assets. Survey scope and definitions
The official USD 167.858 million figure and the FY2025 survey's USD 166.402 million describe their respective dates and reporting categories. The official balance retains its stated label, endowment and gift annuity pool market value. Official financial scope
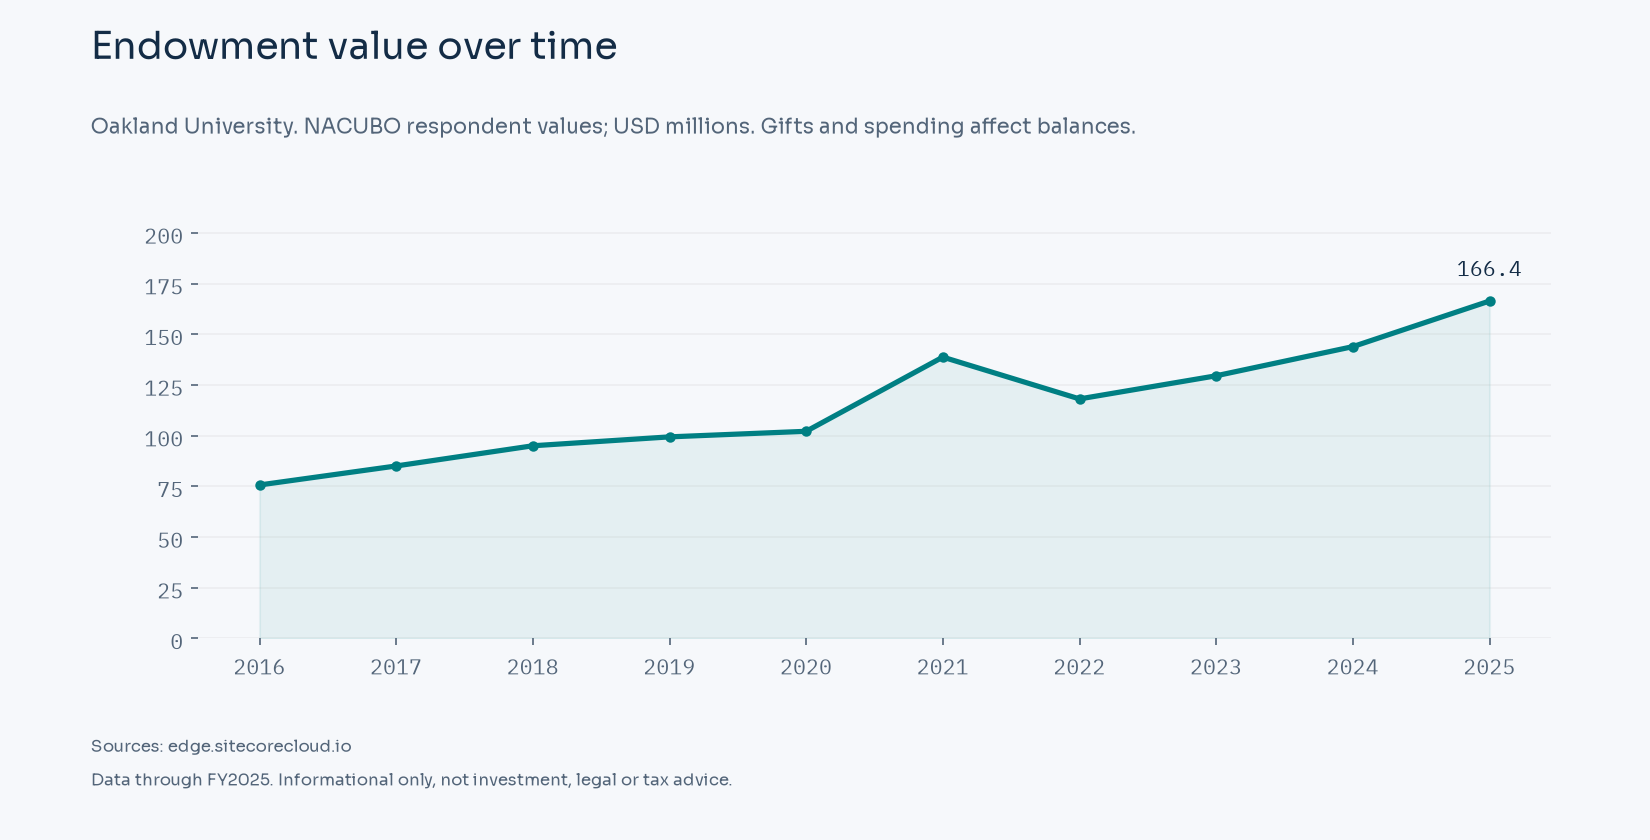
| Fiscal year | Survey endowment, USD millions |
|---|---|
| FY2016 | 75.673 |
| FY2017 | 85.050 |
| FY2018 | 95.008 |
| FY2019 | 99.399 |
| FY2020 | 102.150 |
| FY2021 | 138.740 |
| FY2022 | 118.117 |
| FY2023 | 129.534 |
| FY2024 | 143.906 |
| FY2025 | 166.402 |
The FY2025 survey value for Oakland University is USD 166.402 million, compared with USD 143.906 million for FY2024. The USD 22.496 million movement is 15.63% of the earlier balance. It includes changes in investments as well as additions and distributions. NACUBO explicitly distinguishes this change in market value from an investment rate of return. FY2025 respondent values and definitions
The available history begins in FY2016 at USD 75.673 million and ends in FY2025 at USD 166.402 million. The change across those observations is USD 90.729 million. The smallest reported balance in the displayed series is USD 75.673 million in FY2016; the largest is USD 166.402 million in FY2025. NACUBO historical workbook
Investment returns
| Portfolio | Period end | Horizon | Reported return |
|---|---|---|---|
| Endowment and gift annuity investment pool | June 30, 2025 | 1 year | 12.9% |
| Endowment and gift annuity investment pool | June 30, 2025 | 5 years, annualized | 11.2% |
A trailing multi-year return is an annualized compound result over the period shown. The one-year figure covers the final year. These periods overlap, so their returns are not added. A published dollar investment gain can reflect accounting categories and cash flows that differ from the percentage performance calculation. Return definitions and reporting basis
Asset allocation
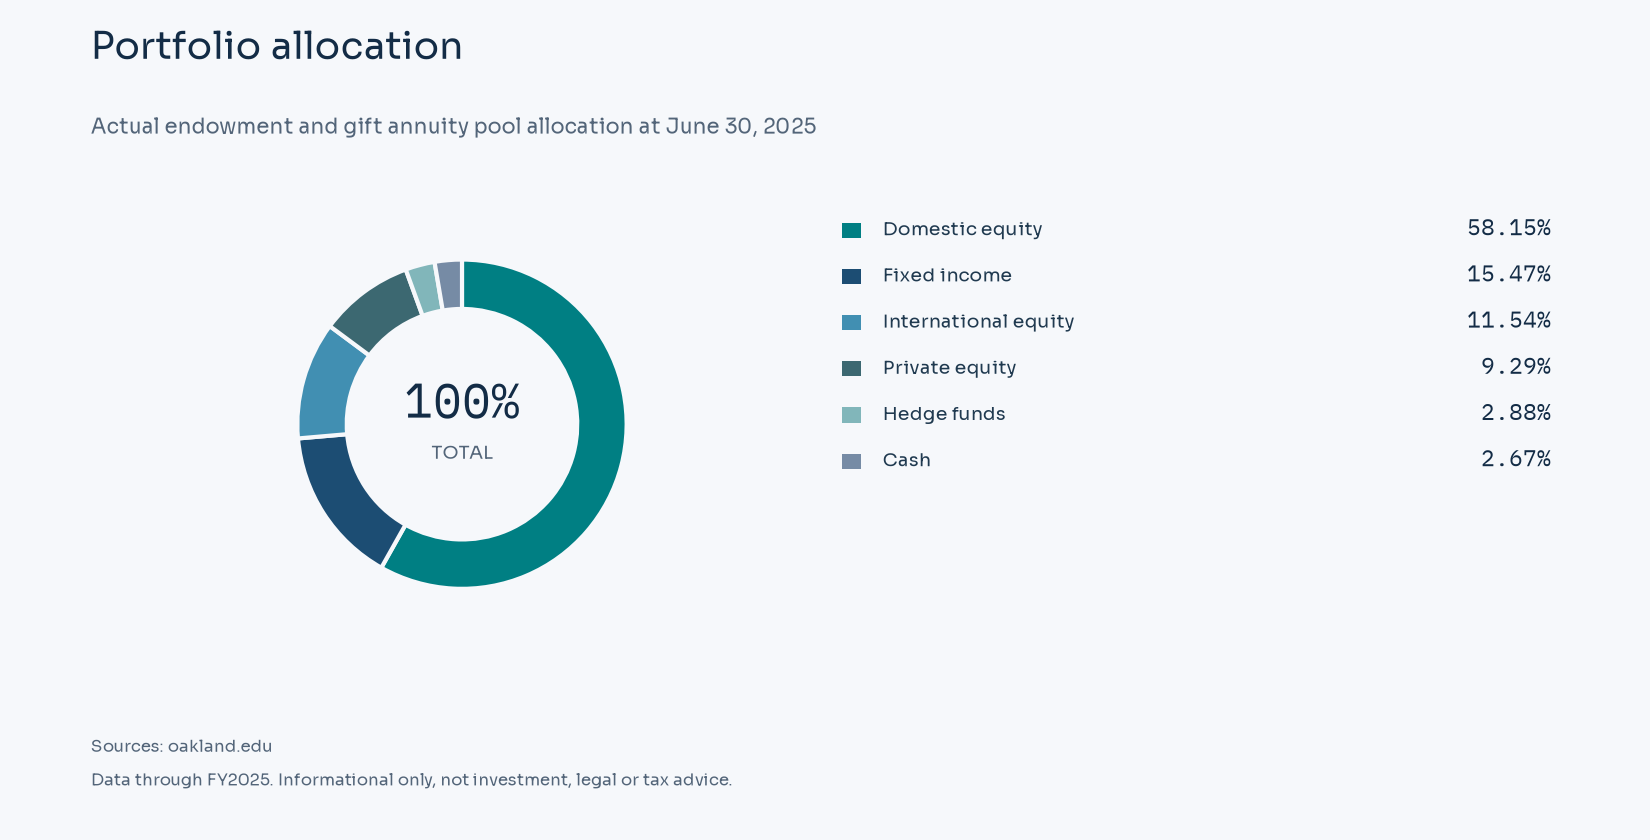
| Published category | Weight |
|---|---|
| Domestic equity | 58.15% |
| Fixed income | 15.47% |
| International equity | 11.54% |
| Private equity | 9.29% |
| Hedge funds | 2.88% |
| Cash | 2.67% |
Actual endowment and gift annuity pool allocation at June 30, 2025. Allocation report
Spending policy and payout
Oakland's stated spending distribution rate is 4.5% of the twelve-quarter moving average market value, using beginning-of-quarter valuations and a one-quarter lag. The FY2025 giving report lists $4.08027292 million distributed to support endowed purposes. Spending disclosure
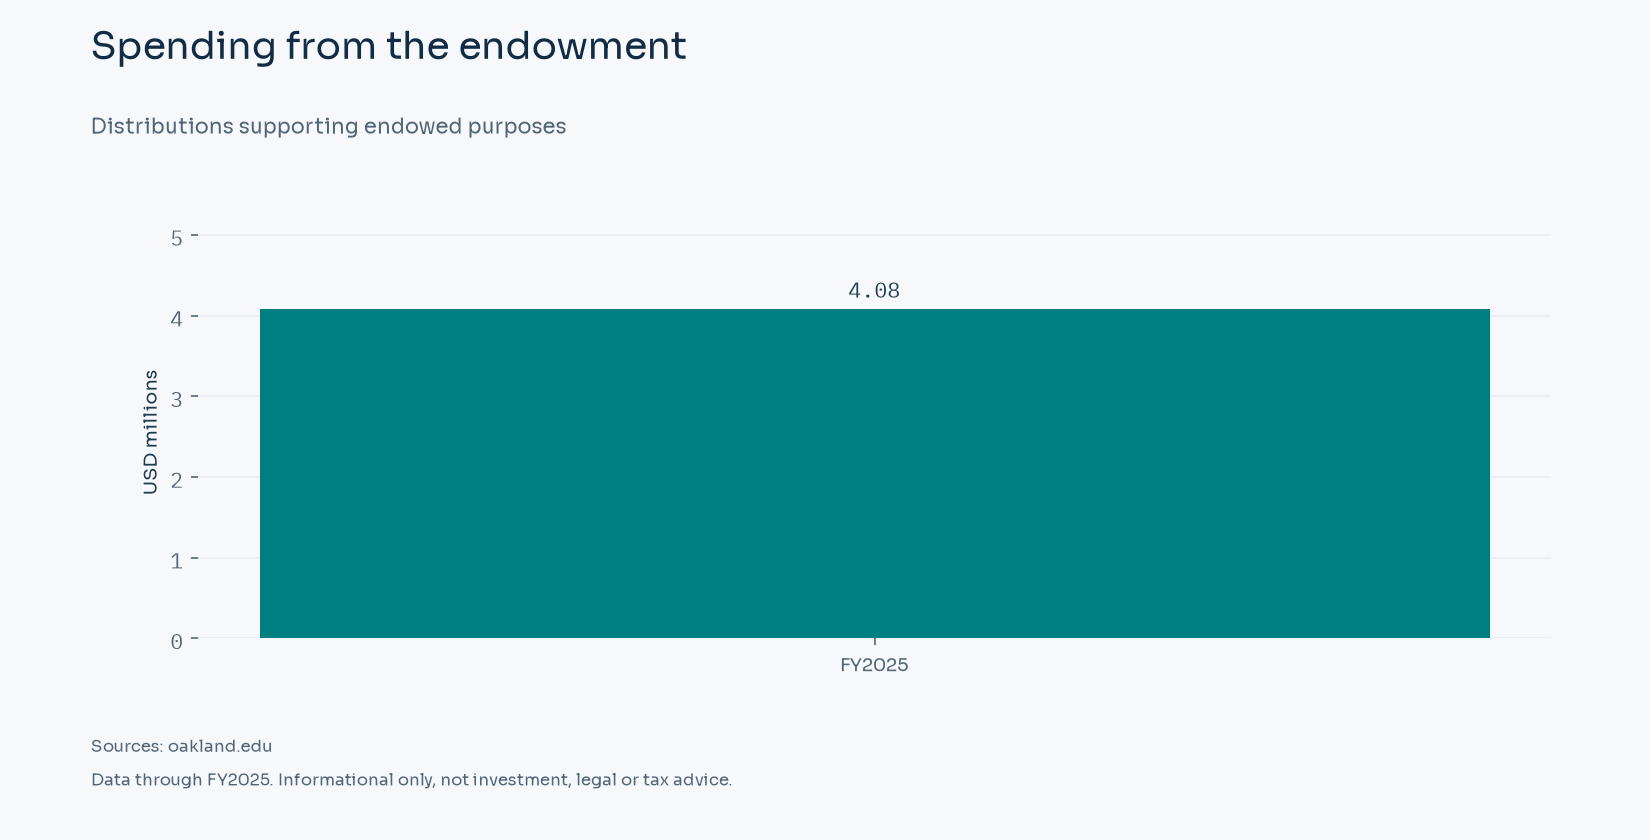
| Fiscal year | Distributions supporting endowed purposes, USD millions |
|---|---|
| FY2025 | 4.080 |
For Oakland University, an appropriation can precede a beneficiary's expenditure. Its timing can differ from the cash expense recorded by the institution. Spending measures
Governance and investment office
Oakland's Board of Trustees appoints an external endowment investment adviser. Treasury Management is responsible for investment management and reporting for the endowment and working-capital portfolios. It meets with the external adviser under board-approved investment policies. Investment governance
Federal excise tax on investment income
Public Law 119-21 changed Section 4968 for tax years beginning after December 31, 2025. Applicable private institutions must have at least 3,000 tuition-paying students in the preceding tax year, with more than half located in the United States, and student-adjusted endowment of at least $500,000. The rates are 1.4% from $500,000 through $750,000 per student, 4% above $750,000 through $2 million, and 8% above $2 million. Enacted law, Section 70415
Section 4968 excludes state colleges and universities described in Section 511(a)(2)(B). Supporting foundations retain their own legal and filing identities, with related-organization rules read alongside the public-university exclusion. A foundation's public endowment value does not, by itself, assign it a private-college tax tier.
The tax is imposed on net investment income. Student-adjusted endowment uses prior-year fair values for assets other than those used directly for exempt purposes. The statute also contains student-count and related-organization provisions. A spending policy applies to an institution's chosen asset base, while the tax applies to investment income under federal rules.
FY2025 size-band comparison
The FY2025 survey value of USD 166.402 million places this respondent in the $100M to $250M band. The published band contains 154 respondents and USD 24.5 billion of aggregate assets. Its average five-year annualized net return is 9.6%, and its ten-year average is 7.4%. The size band uses the FY2025 NACUBO balance. NCSE size groups NCSE average net returns
| NCSE measure | FY2025 average |
|---|---|
| One-year net return | 10.5% |
| Five-year annualized net return | 9.6% |
| Ten-year annualized net return | 7.4% |
| Effective spending rate | 4.9% |
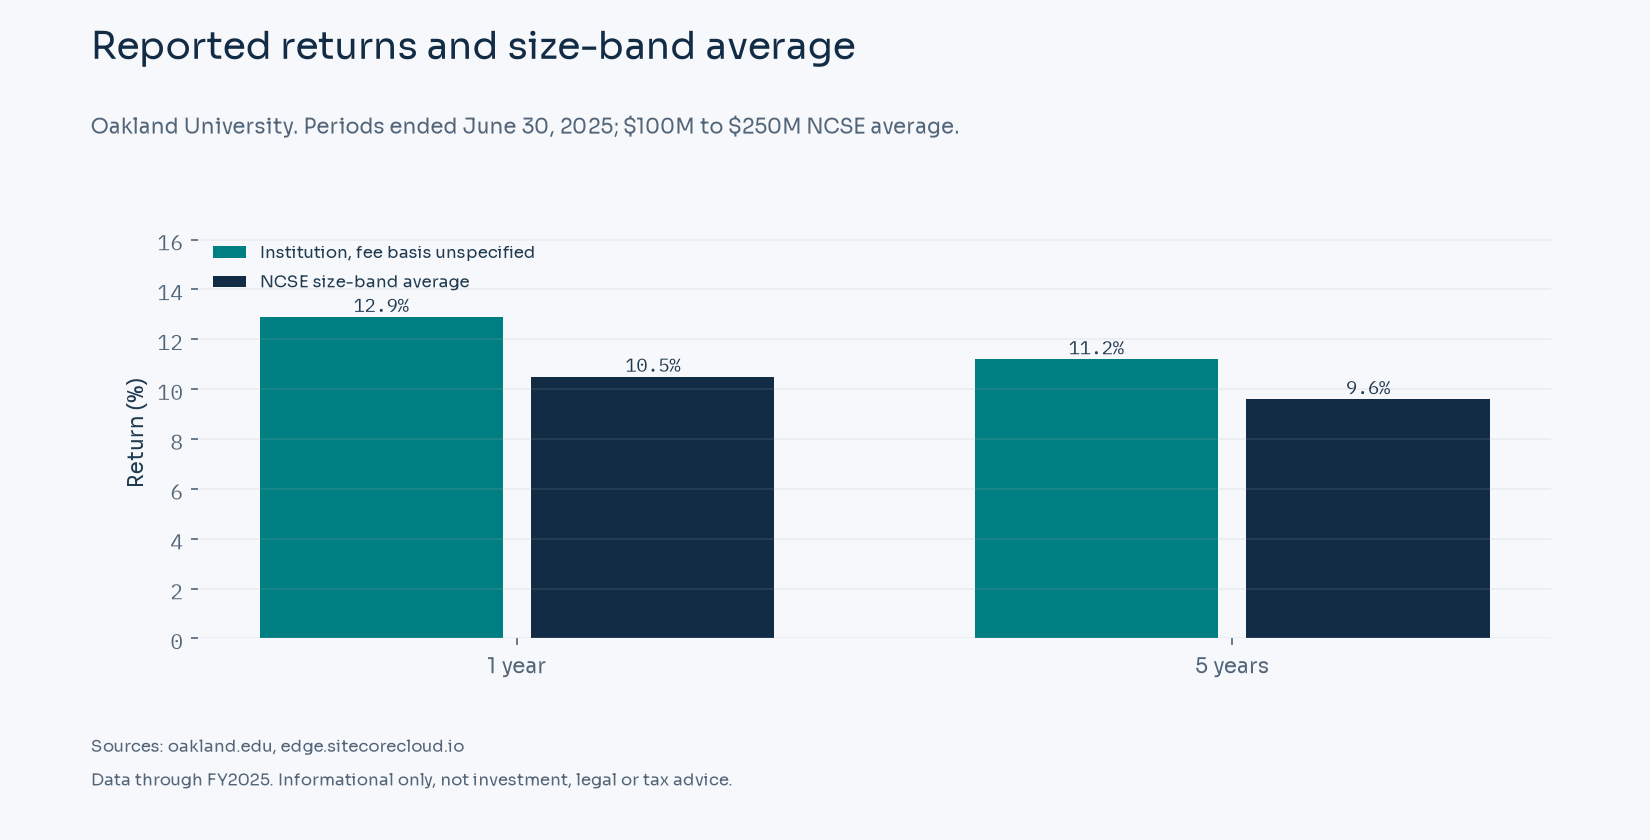
Institution fee treatment is unspecified in the cited performance disclosure. NCSE reports net of external management fees and expenses. These fee bases can affect the comparison.
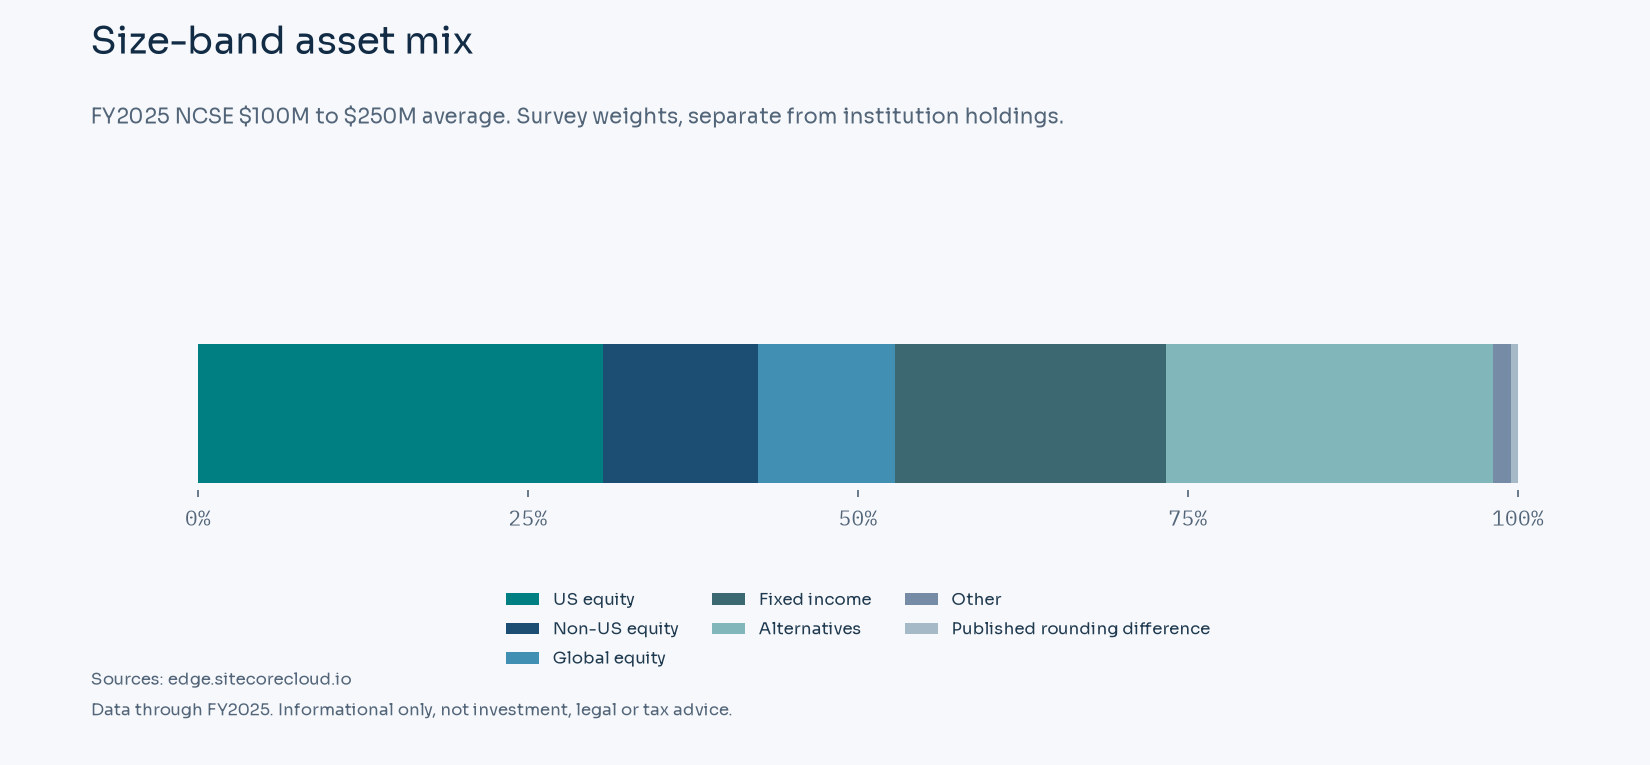
NCSE's allocation categories combine strategies with different liquidity and valuation practices. Its Alternatives group can include private capital, hedge funds and real assets. Matching that broad weight would not establish identical holdings. The displayed mix is a survey average, not this institution's target allocation. Published category weights are shown with an explicit rounding difference so the full bar totals 100%. NCSE allocation definitions
Public records and reporting dates
NACUBO's respondent is Oakland University. Annual financial statements and any nonprofit return can cover a different legal entity or a wider group of resources. A university, a supporting foundation and an investment pool can each report its own assets. Total organizational assets also include resources outside the endowment, and the tax-return accounting period can differ from the survey's reporting year. Those distinctions govern how public records are compared. Respondent identity
Sources
- https://www.oakland.edu/giving/the-impact-of-philanthropy/endowments/
- https://edge.sitecorecloud.io/nacubo1-nacubo-prd-dc8b/media/Nacubo/Documents/EndowmentFiles/2025-NCSE-Endowment-Market-Values-for-US-and-Canadian-Institutions-FINAL.xlsx
- https://edge.sitecorecloud.io/nacubo1-nacubo-prd-dc8b/media/Nacubo/Documents/research/Final-Endowment-Market-Values--2023-to-1974-Revised.xlsx
- https://edge.sitecorecloud.io/nacubo1-nacubo-prd-dc8b/media/Nacubo/Documents/EndowmentFiles/2025-NCSE-Public-Tables--Spending-Rates-FINAL.pdf
- https://www.oakland.edu/finance/departments/treasury-management/index.html
- https://www.congress.gov/119/plaws/publ21/PLAW-119publ21.pdf
- https://edge.sitecorecloud.io/nacubo1-nacubo-prd-dc8b/media/Nacubo/Documents/EndowmentFiles/2025-NCSE-Public-Tables--Number-of-NCSE-Participants-FINAL.pdf
- https://edge.sitecorecloud.io/nacubo1-nacubo-prd-dc8b/media/Nacubo/Documents/EndowmentFiles/2025-NCSE-Public-Tables--10-Year-Returns-by-Size-and-Type-FINAL.pdf
- https://edge.sitecorecloud.io/nacubo1-nacubo-prd-dc8b/media/Nacubo/Documents/EndowmentFiles/2025-NCSE-Public-Tables--Summary-Asset-Allocations-FINAL.pdf
Related profiles
- Middle Tennessee State University (USD 167.7 million)
- University of North Florida (USD 165.0 million)
- The University of Texas Rio Grande Valley (USD 171.3 million)
- Montclair State University (USD 157.9 million)
- University of North Carolina at Wilmington (USD 178.4 million)
- Eastern Illinois University Foundation (USD 121.9 million)