
{{ p.title }}
{{ b.text }}
{{ g.text }} {{ g.text }} {{ g.text }}
| {{ c.v }} |
|---|
{{ b.note }}
{{ p.kfImg.note }}
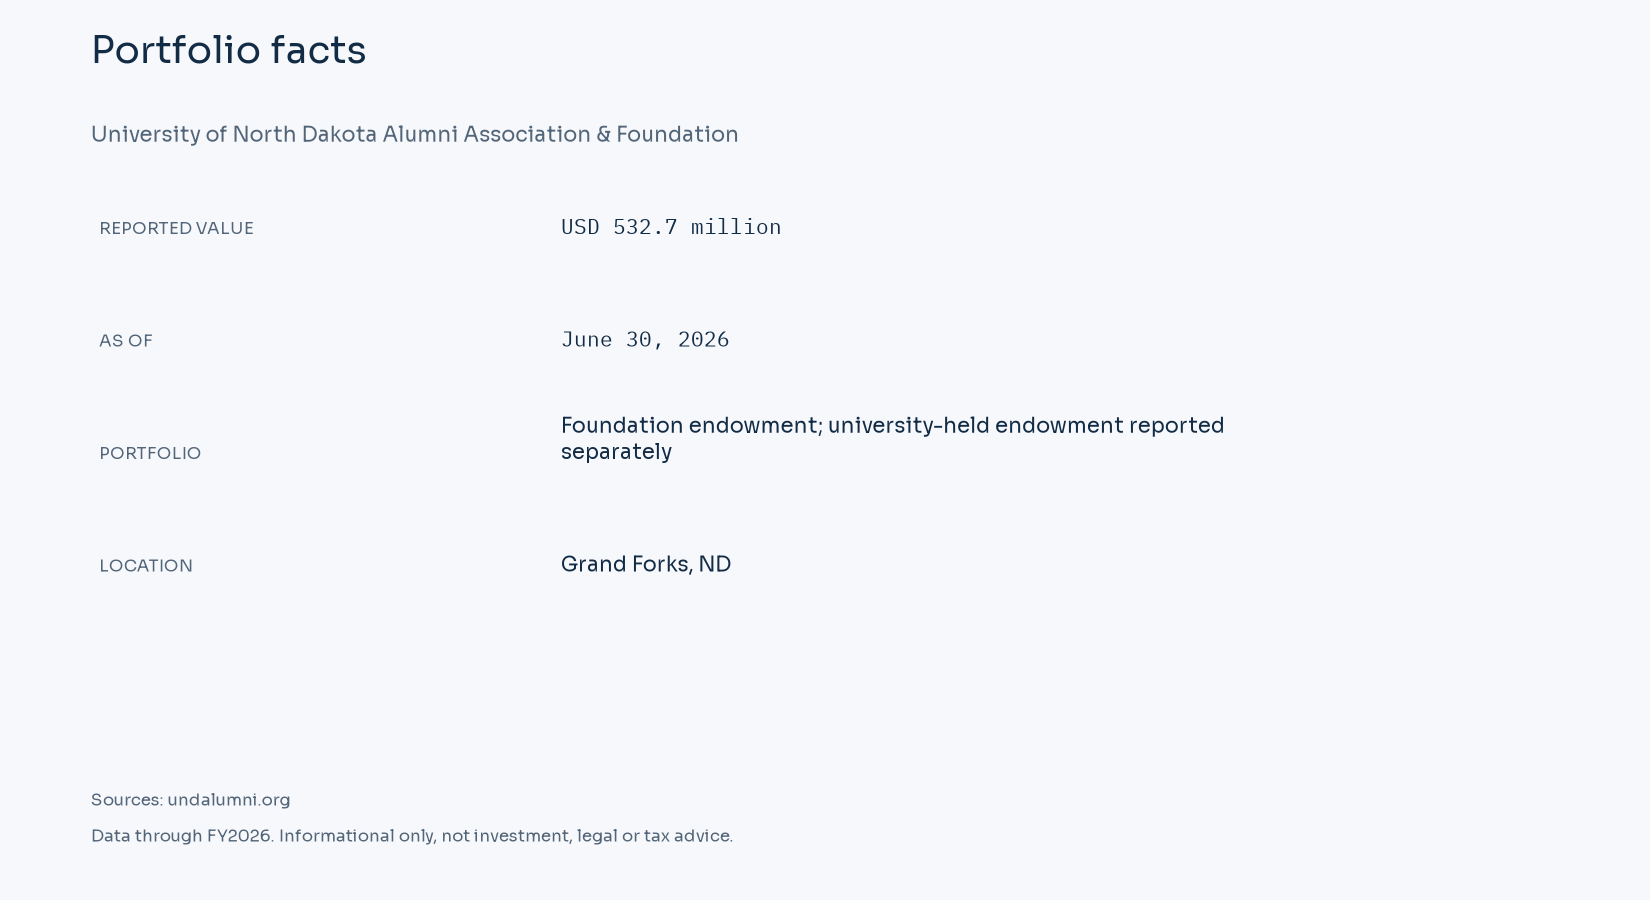
University of North Dakota Alumni Association & Foundation reports USD 532.7 million in foundation endowment market value at June 30, 2026. Balance source
UND's official June 30, 2026 summary reports $532.689706 million in the foundation endowment and $24.696650 million held by the university, for $557.386356 million combined. Its September 30, 2026 update gives $538.379580 million and $24.791156 million, respectively. The percentage returns and allocation below follow that September update, while the fiscal-year closing figure is dated June 30. Official report
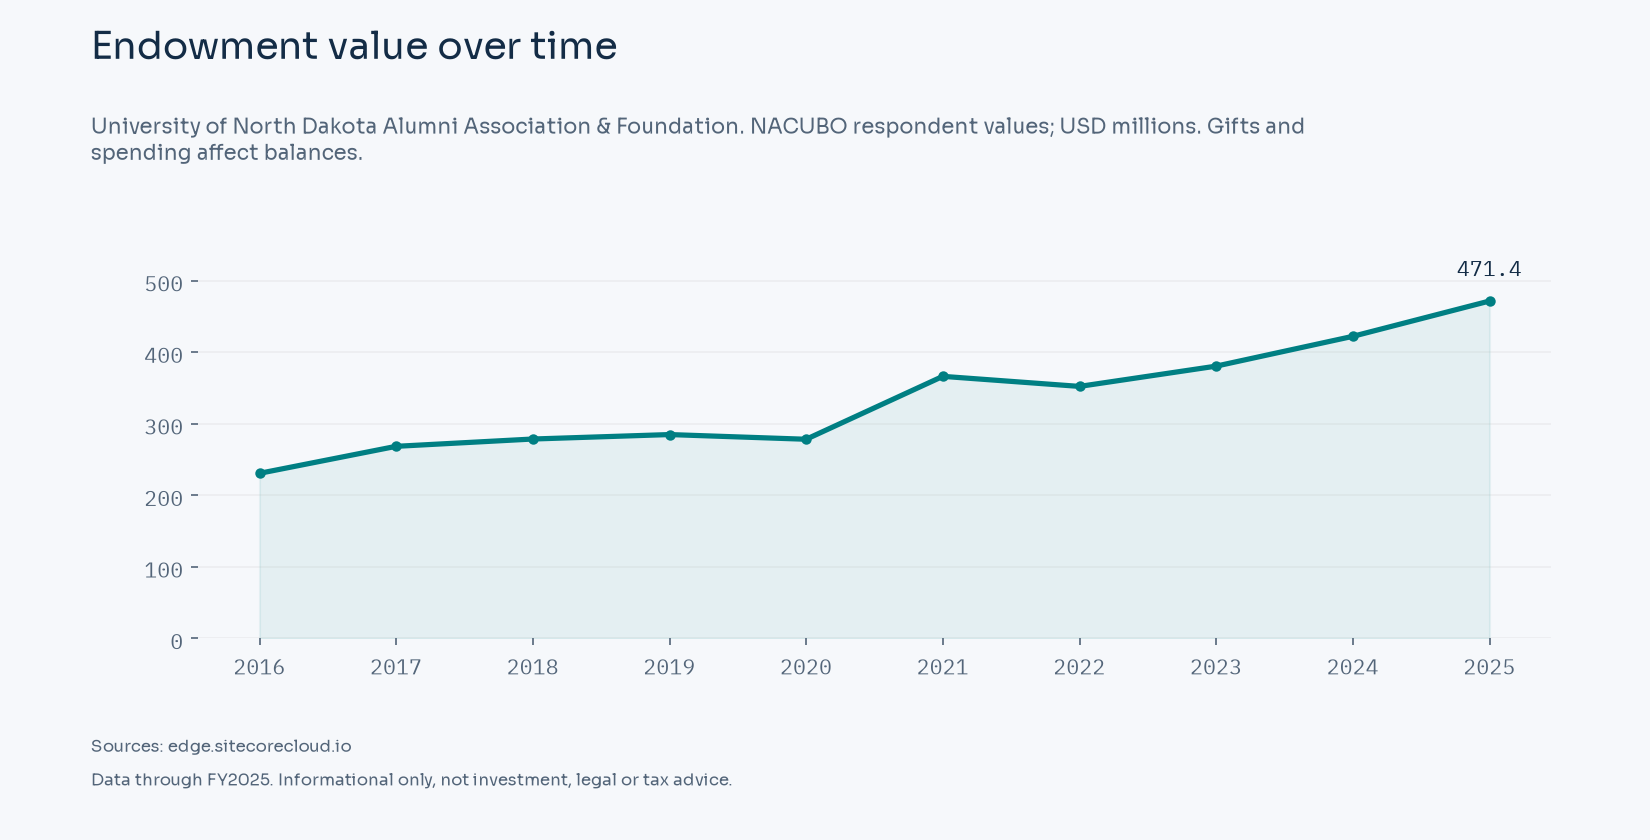
For University of North Dakota Alumni Association & Foundation, the survey reports USD 471.396 million for FY2025 and USD 422.057 million for FY2024. These totals retain the respondent's published scope. A pooled investment fund can also hold resources outside permanent endowments, while financial statements can include interests administered by outside trustees. Those accounting boundaries help explain why one organization may publish more than one long-term-asset figure. Closing market value alone does not identify how much support a beneficiary can spend. Survey scope and definitions
The official USD 532.690 million figure and the FY2025 survey's USD 471.396 million describe their respective dates and reporting categories. The official balance retains its stated label, foundation endowment market value. The reporting date and the defined asset category govern the comparison. Official financial scope
| Fiscal year | Survey endowment, USD millions |
|---|---|
| FY2016 | 230.656 |
| FY2017 | 268.375 |
| FY2018 | 278.583 |
| FY2019 | 284.804 |
| FY2020 | 278.253 |
| FY2021 | 366.147 |
| FY2022 | 352.099 |
| FY2023 | 380.434 |
| FY2024 | 422.057 |
| FY2025 | 471.396 |
The FY2025 survey value for University of North Dakota Alumni Association & Foundation is USD 471.396 million, compared with USD 422.057 million for FY2024. The USD 49.339 million movement is 11.69% of the earlier balance. It includes changes in investments as well as additions and distributions. NACUBO explicitly distinguishes this change in market value from an investment rate of return. FY2025 respondent values and definitions
The available history begins in FY2016 at USD 230.656 million and ends in FY2025 at USD 471.396 million. The change across those observations is USD 240.740 million. The smallest reported balance in the displayed series is USD 230.656 million in FY2016; the largest is USD 471.396 million in FY2025. The change in assets includes gifts and distributions as well as investment results. NACUBO historical workbook
| Portfolio | Period end | Horizon | Reported return |
|---|---|---|---|
| Foundation endowment; university-held endowment reported separately | September 30, 2026 | 1 year | 10.9% |
| Foundation endowment; university-held endowment reported separately | September 30, 2026 | 5 years, annualized | 7.6% |
| Foundation endowment; university-held endowment reported separately | September 30, 2026 | 10 years, annualized | 8.5% |
Fee basis: Net of fees.
A trailing multi-year return is an annualized compound result over the period shown. The one-year figure covers the final year. These periods overlap, so their returns are not added. A published dollar investment gain can reflect accounting categories and cash flows that differ from the percentage performance calculation. Return definitions and reporting basis
| Published category | Weight |
|---|---|
| Equity | 45.3% |
| Fixed income | 23.4% |
| Diversifying strategies | 18.3% |
| Inflation protection | 13% |
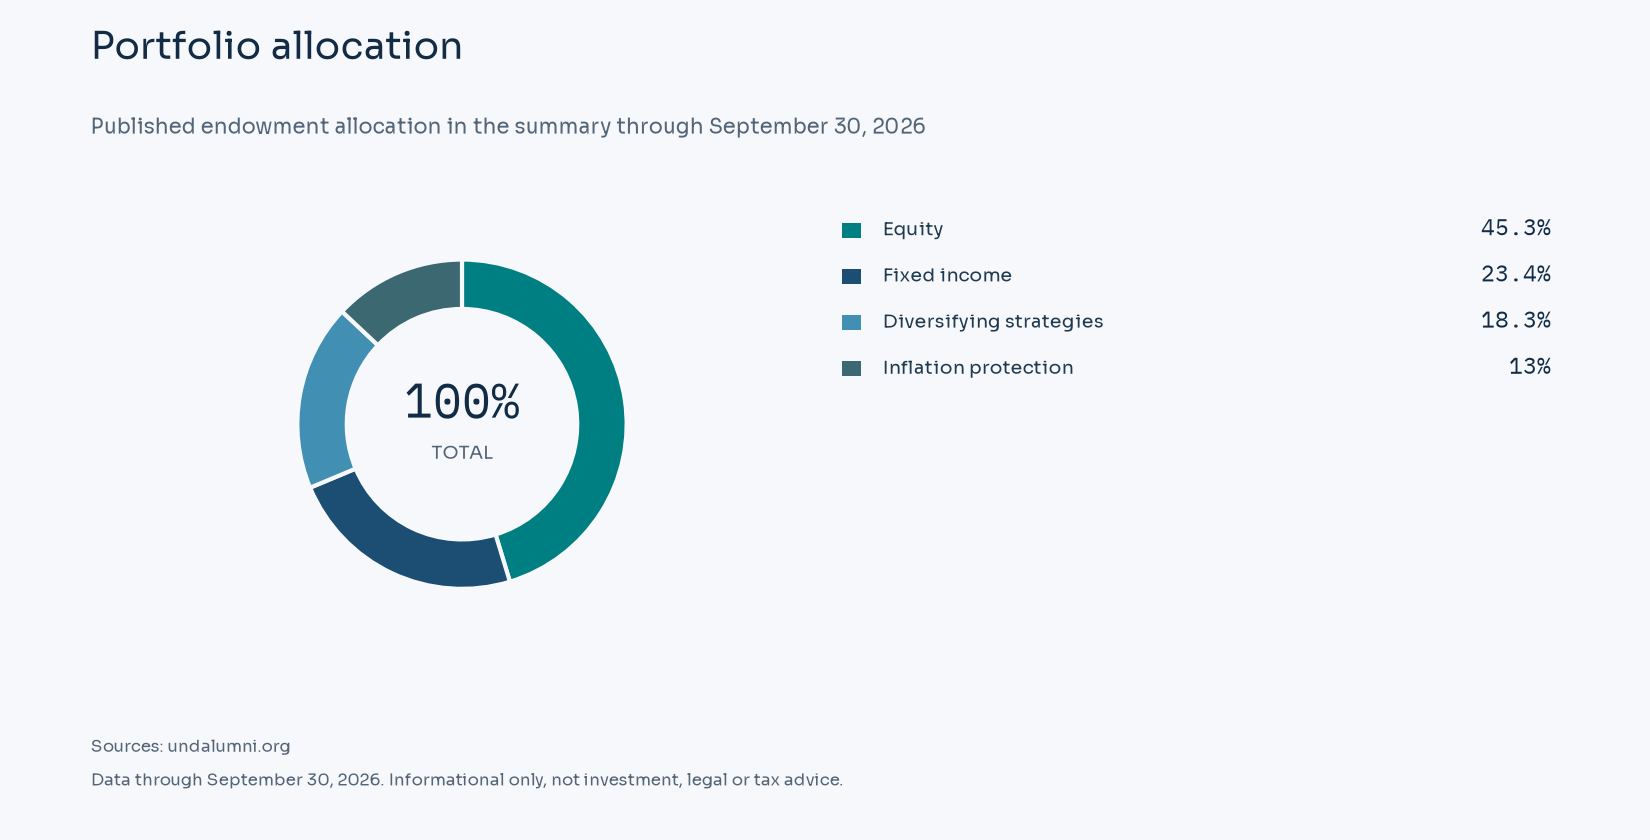
Published endowment allocation in the summary through September 30, 2026. Allocation report
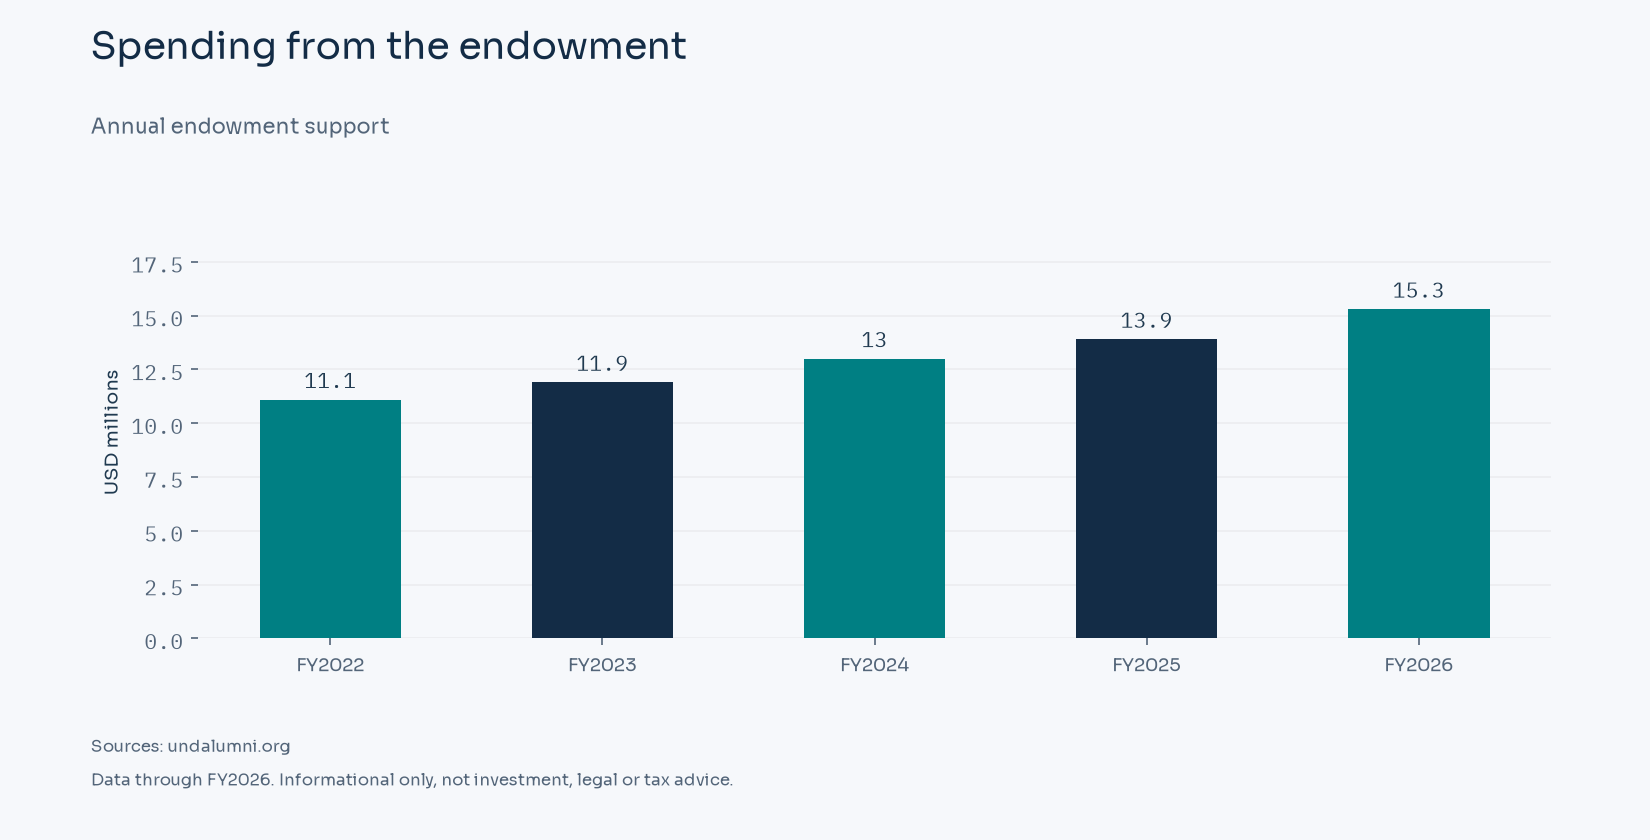
The summary reports annual support of $15.3 million in FY2026, compared with $13.9 million in FY2025. The five annual payouts from FY2022 through FY2026 total $65.2 million. These are support flows; they are separate from the quarterly portfolio balances and trailing investment returns. Spending disclosure
| Fiscal year | Annual endowment support, USD millions |
|---|---|
| FY2022 | 11.100 |
| FY2023 | 11.900 |
| FY2024 | 13.000 |
| FY2025 | 13.900 |
| FY2026 | 15.300 |
Distributions remain subject to each fund's donor restrictions. An appropriation authorizes support for those purposes; a beneficiary can use the cash in a later accounting period. Spending measures
The UND Alumni Association & Foundation manages and invests endowed funds for student support, faculty positions and campus programs. The foundation and university-held endowments have separately stated balances. The foundation's own market value is used when describing its legal and investment scope. Investment governance
Public Law 119-21 changed Section 4968 for tax years beginning after December 31, 2025. Applicable private institutions must have at least 3,000 tuition-paying students in the preceding tax year, with more than half located in the United States, and student-adjusted endowment of at least $500,000. The rates are 1.4% from $500,000 through $750,000 per student, 4% above $750,000 through $2 million, and 8% above $2 million. Enacted law, Section 70415
Section 4968 excludes state colleges and universities described in Section 511(a)(2)(B). Supporting foundations retain their own legal and filing identities, with related-organization rules read alongside the public-university exclusion. A foundation's public endowment value does not, by itself, assign it a private-college tax tier.
Section 4968 taxes net investment income. Its asset and student definitions govern applicability and the rate.
The FY2025 survey value of USD 471.396 million places this respondent in the $250M to $500M band. The published band contains 102 respondents and USD 37.1 billion of aggregate assets. Its average five-year annualized net return is 10.0%, and its ten-year average is 7.6%. The size band uses the FY2025 NACUBO balance. NCSE size groups NCSE average net returns
| NCSE measure | FY2025 average |
|---|---|
| One-year net return | 11% |
| Five-year annualized net return | 10.0% |
| Ten-year annualized net return | 7.6% |
| Effective spending rate | 5.2% |
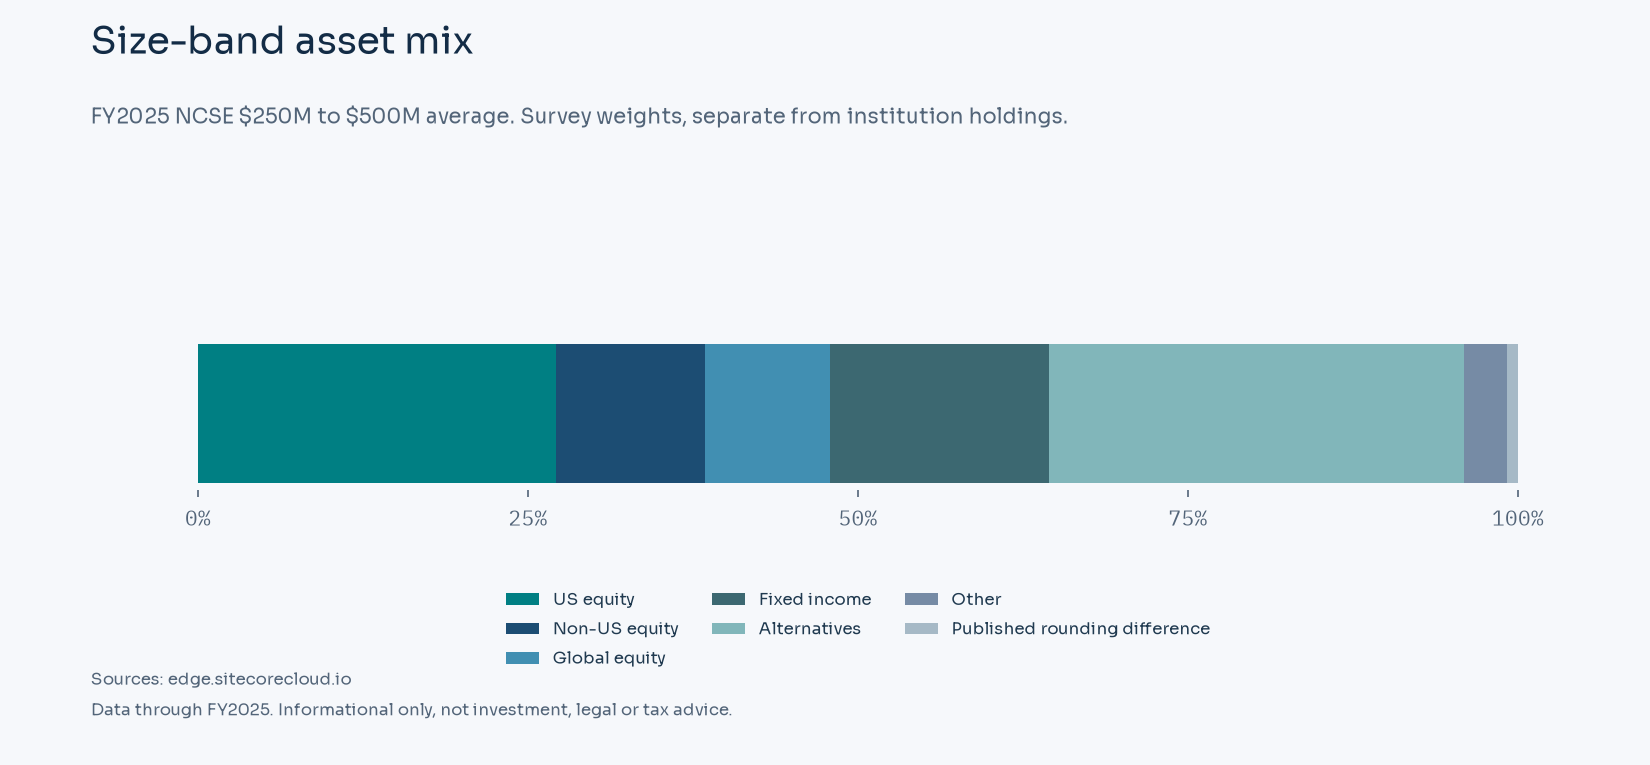
NCSE's allocation categories combine strategies with different liquidity and valuation practices. Its Alternatives group can include private capital, hedge funds and real assets. Matching that broad weight would not establish identical holdings. The displayed mix is a survey average, not this institution's target allocation. Published category weights are shown with an explicit rounding difference so the full bar totals 100%. NCSE allocation definitions
NACUBO's respondent is University of North Dakota Alumni Association & Foundation. Annual financial statements and any nonprofit return can cover a different legal entity or a wider group of resources. A university, a supporting foundation and an investment pool can each report its own assets. Total organizational assets also include resources outside the endowment, and the tax-return accounting period can differ from the survey's reporting year. Those distinctions govern how public records are compared. Respondent identity

The #1 most in-depth guide to endowment funds with in-depth profiles, infographics, resources, and research
I started Family Office Club 19 years ago. I would rather build a real relationship than sell you something. I am not a broker. I am not a bank. I do not charge for anything on this site.
Endowments are some of the most studied investors in the world, and the numbers are scattered across financial reports, press releases and student newspapers. This site puts each endowment's figures in one place, from its own reports first, names every source, and says plainly when a number has not been published.
We run 16 in-person events a year, 4 Super Summits and 12 masterminds, in NYC, Fort Lauderdale, Dallas, Los Angeles and Beverly Hills. 300 of them over 19 years.
"The Family Office Club is unique as a community. The thing I admire about you is that you started with your family, making that a priority."
Todd Heiner · centimillionaire, co-founder of Express Locations
Each fact names its source and its date. When two sources disagree, we show both. When an endowment has not published a number, we say so.
{{ dirIntro }}
| {{ r.type }} | {{ r.loc }} | {{ r.size }} | {{ r.fy }} |
Size is the tracked endowment market value in USD, mostly from the NACUBO-Commonfund Study of Endowments FY2025 public table. Linked names open a full profile with the institution's own latest figures, dates and currency.
| {{ c.v }} |
|---|
| {{ c.v }} |
|---|
| {{ c.v }} |
|---|
| {{ c.v }} |
|---|
{{ guidesIntro }}
This page does not exist or has moved.
Ranked from published profiles only, using each endowment's latest reported fiscal year. The basis and date sit next to every number. {{ stats.queued }} endowments are still in research and will be added as their profiles publish.
| # | Endowment | Country | Value | Return | Fiscal year and date |
|---|---|---|---|---|---|
| {{ r.rank }} | {{ r.name }} | {{ r.country }} | {{ r.value }} | {{ r.ret }} | {{ r.fy }}, {{ r.asOf }} |
Practical guides for raising from, working with and running endowments. Each one is being written now and will publish here, free.
Tell me what you are raising for. I will tell you which endowments look like a fit, and which rooms are worth being in. I read these myself.
Correct it or claim it. It is free. Send the page, the change and a public source, and we will update it and note the date.
For board members, investment committee members, donors, students and journalists. Every profile shows value, return, spending and allocation with the fiscal year and source next to each figure.
Each fact names its source and its date. We start with the institution's own financial report, investment office report and press release, then official filings, then third-party reporting. Figures are tied to a fiscal year, because most endowments report once a year. When two sources disagree, we show both. When an endowment has not published a number, we say so rather than estimate it silently.
To report an error or ask for a change or removal, email Richard@Endowments.com or text (808) 600-9260.
{{ a.a }}
16 in-person events a year, 4 Super Summits and 12 masterminds, plus monthly webinars. Run by Family Office Club.

Endowments.com is a research resource on university, college and foundation endowments. It profiles 775 endowments, including university, college, foundation and hospital endowments, built from each institution's own reports and public filings, and runs the Endowments by Size Band benchmark study. Every figure carries its source and date.
I started Family Office Club 19 years ago at 26, as my 12th startup and the first one that worked. All three of my daughters are in the business with me now. My father raised $1 billion for non-profits before I ever started, so I grew up watching this.
Since then: 300+ in-person events, 1,500 investors on stage, 250+ family offices created or formalized, 46 transactions off my own balance sheet, and CIO of a $180M single family office.
I am not a broker. I am not a bank. I do not charge for anything on this site. I built it because endowment figures are spread across hundreds of reports and press releases, and few places put them side by side with sources.
Text or WhatsApp me at (808) 600-9260, or email Richard@Endowments.com.
I'm Richard C. Wilson. I started Family Office Club 19 years ago. I read the messages that come in through this site myself. Text or WhatsApp me at (808) 600-9260, or email Richard@Endowments.com. Thank you.
This page is for general information only and is not investment, tax or legal advice. Figures come from the public sources listed and may have changed.