
Queen's University: endowment and investment office
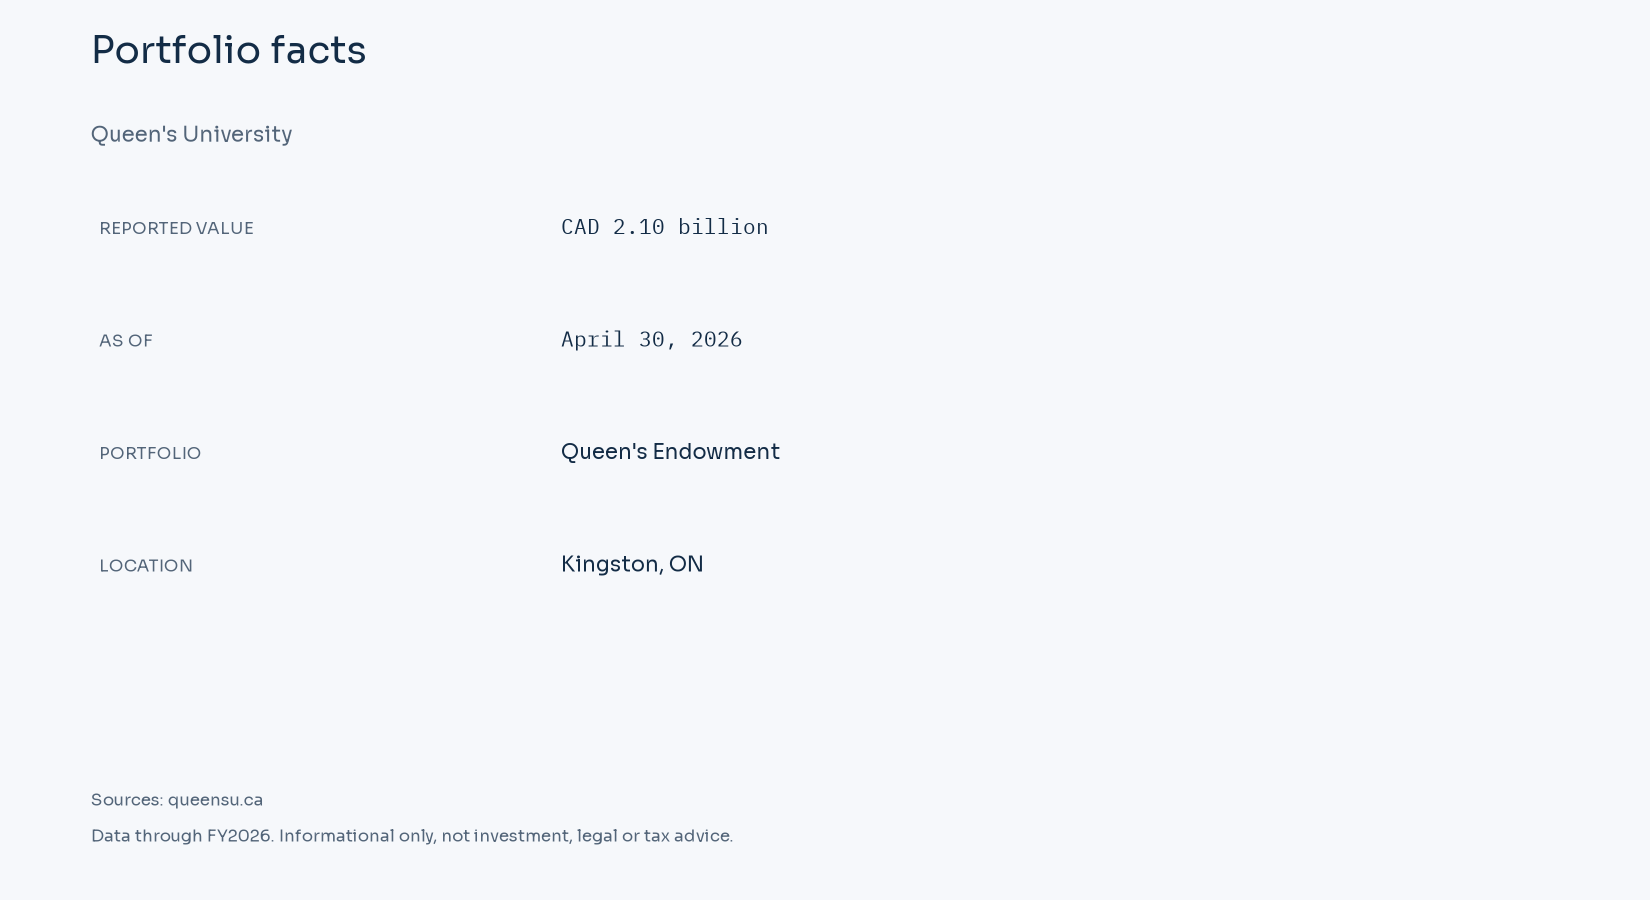
Queen's University reports CAD 2.10 billion in endowment, rounded official cad value for April 30, 2026. Balance source
Queen's FY2026 endowment report gives CAD 2.10 billion invested for future support and CAD 52.6 million donated to the endowment. It dates annual endowment distributions to April 30, 2026. A later September portfolio update is a different valuation date from the fiscal-year report. The Canadian-dollar annual figure and the U.S.-dollar NACUBO balance are kept distinct. Official report
Key facts
- Reported value
- CAD 2.10 billion
- As of
- April 30, 2026
- Portfolio
- Queen's Endowment
- Location
- Kingston, ON
Endowment size and reporting scope
The reported balance is a stock of assets measured at a date. Annual support and investment income are flows across a fiscal year. Donor-restricted funds and board-designated funds can share an investment vehicle while retaining different spending permissions. A consolidated balance sheet also includes buildings, receivables and liabilities, which are outside an endowment-only figure. Pool value and the legal institution's net assets therefore require separate labels. Survey scope and definitions
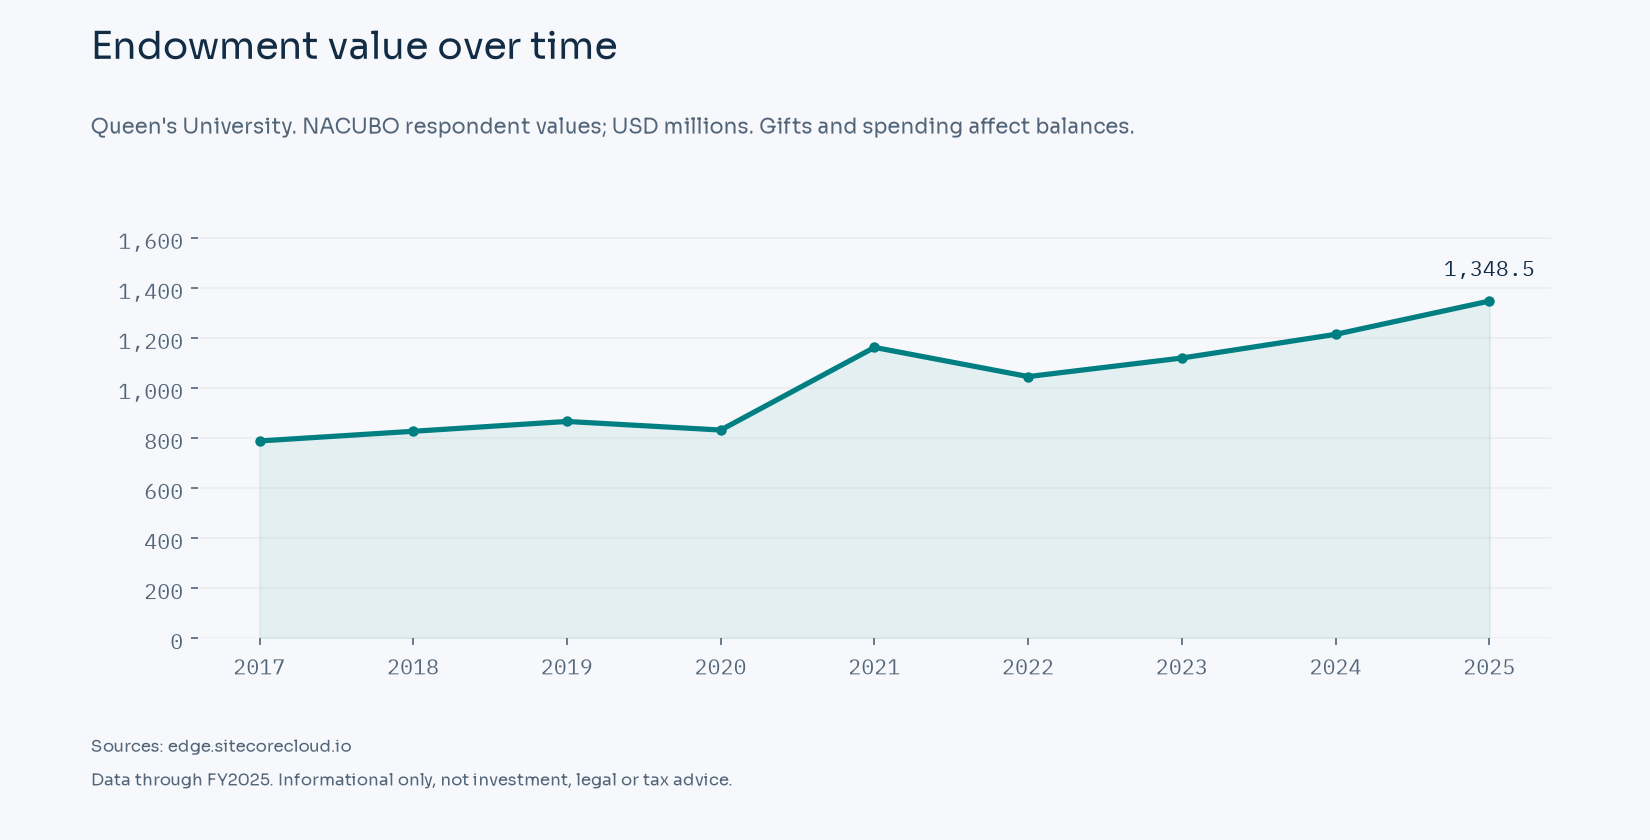
The official CAD 2,100.000 million figure and the FY2025 survey's USD 1,348.520 million describe their respective dates and reporting categories. The official balance retains its stated label, endowment, rounded official cad value. A change in currency, period or included accounts can produce a different total; the figures are presented separately. Official financial scope
| Fiscal year | Survey endowment, USD millions |
|---|---|
| FY2017 | 789.167 |
| FY2018 | 827.855 |
| FY2019 | 867.210 |
| FY2020 | 832.821 |
| FY2021 | 1,163.157 |
| FY2022 | 1,046.511 |
| FY2023 | 1,120.722 |
| FY2024 | 1,215.363 |
| FY2025 | 1,348.520 |
The FY2025 survey value for Queen's University is USD 1,348.520 million, compared with USD 1,215.363 million for FY2024. The USD 133.157 million movement is 10.96% of the earlier balance. It includes changes in investments as well as additions and distributions. NACUBO explicitly distinguishes this change in market value from an investment rate of return. FY2025 respondent values and definitions
The available history begins in FY2017 at USD 789.167 million and ends in FY2025 at USD 1,348.520 million. The change across those observations is USD 559.353 million. The smallest reported balance in the displayed series is USD 789.167 million in FY2017; the largest is USD 1,348.520 million in FY2025. These are closing asset values. They do not show how much of a year's movement came from new gifts, spending or investment results. NACUBO historical workbook
The survey expresses Canadian institutions' balances in U.S. dollars using the conversion conventions stated in the workbook. Exchange-rate movements can affect changes between fiscal years. The official Canadian-dollar balance elsewhere on this page retains its own currency and fiscal date. The U.S. historical values are not spliced into a Canadian-dollar line.
Spending policy and payout
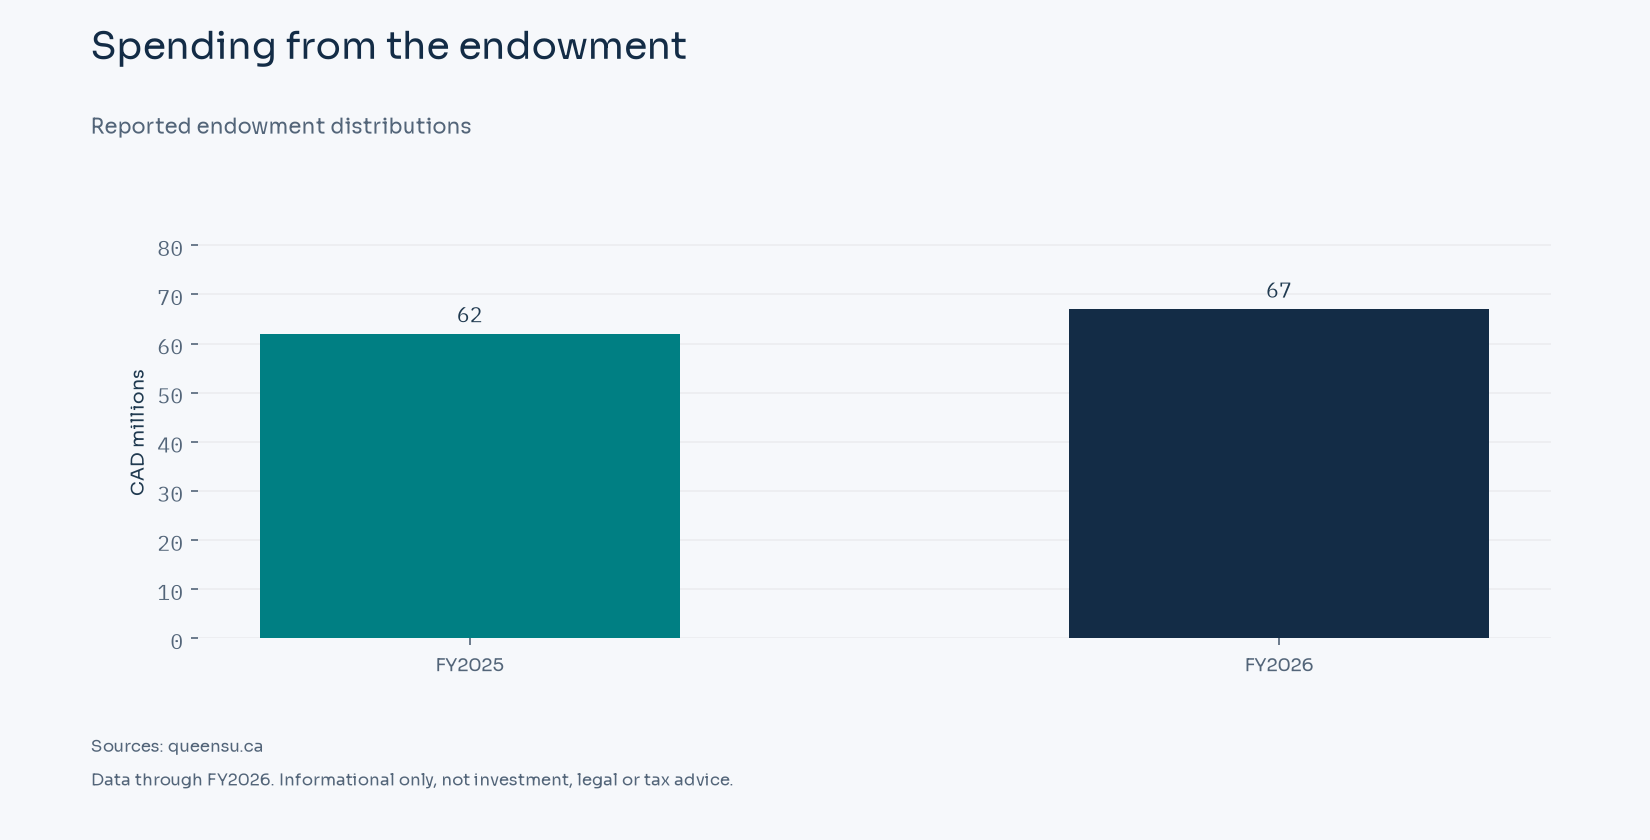
Queen's reports CAD 67 million in annual endowment distributions for FY2026, compared with CAD 62 million for FY2025. Its investments office says annual spending is governed by a Board of Trustees approved policy. Distributions support student assistance, academic chairs and other donor-designated purposes. Spending disclosure
| Fiscal year | Reported endowment distributions, CAD millions |
|---|---|
| FY2025 | 62.000 |
| FY2026 | 67.000 |
The size of a spending account is separate from the current market value of its underlying endowment. A transfer from the investment pool authorizes support for the account's purpose. A smoothing formula can delay the effect of market gains or losses on that support. Unspent distributions can also remain available for a beneficiary beyond the year of appropriation. Spending measures
Governance and investment office
Queen's investment services office distinguishes the pooled endowment from the university's sinking fund. The sinking fund supports debt-principal repayments. Endowed assets and sinking-fund assets therefore serve different purposes and cannot be combined into an endowment-only comparison. Investment governance
Federal excise tax on investment income
Public Law 119-21 changed Section 4968 for tax years beginning after December 31, 2025. Applicable private institutions must have at least 3,000 tuition-paying students in the preceding tax year, with more than half located in the United States, and student-adjusted endowment of at least $500,000. The rates are 1.4% from $500,000 through $750,000 per student, 4% above $750,000 through $2 million, and 8% above $2 million. Enacted law, Section 70415 These rates apply to net investment income, using the law's prior-year asset and student-count definitions.
Queen's University is a Canadian institution. The U.S. private-college schedule does not classify its Canadian endowment as a U.S. private-college portfolio. Its Canadian fiscal-year balance and the survey's U.S.-dollar conversion also use different currency conventions. No U.S. institution-specific tier is assigned here.
Reporting comparisons
The U.S. NCSE size-band averages are based on U.S. respondents. This Canadian institution is outside those published comparison groups. The historical dollar series above follows NACUBO's conversion convention; a Canadian investment return follows its stated portfolio currency and fiscal year-end. An April or March reporting period does not match the U.S. June 30 endpoint. Currency and date alignment are needed before comparing percentage performance. NCSE universe and return periods
Public records and reporting dates
NACUBO's respondent is Queen's University. Annual financial statements and any nonprofit return can cover a different legal entity or a wider group of resources. A university, a supporting foundation and an investment pool can each report its own assets. Total organizational assets also include resources outside the endowment, and the tax-return accounting period can differ from the survey's reporting year. Those distinctions govern how public records are compared. Respondent identity
Sources
- https://www.queensu.ca/giving/impact/endowment-report
- https://edge.sitecorecloud.io/nacubo1-nacubo-prd-dc8b/media/Nacubo/Documents/EndowmentFiles/2025-NCSE-Endowment-Market-Values-for-US-and-Canadian-Institutions-FINAL.xlsx
- https://edge.sitecorecloud.io/nacubo1-nacubo-prd-dc8b/media/Nacubo/Documents/research/Final-Endowment-Market-Values--2023-to-1974-Revised.xlsx
- https://edge.sitecorecloud.io/nacubo1-nacubo-prd-dc8b/media/Nacubo/Documents/EndowmentFiles/2025-NCSE-Public-Tables--Spending-Rates-FINAL.pdf
- https://www.queensu.ca/investmentservices/
- https://www.congress.gov/119/plaws/publ21/PLAW-119publ21.pdf
- https://edge.sitecorecloud.io/nacubo1-nacubo-prd-dc8b/media/Nacubo/Documents/EndowmentFiles/2025-NCSE-Public-Tables--10-Year-Returns-by-Size-and-Type-FINAL.pdf
Related profiles
- McMaster University (CAD 1.04 billion)
- University of Alberta (USD 1.40 billion)
- The University of Western Ontario (CAD 1.42 billion)
- McGill University (CAD 2.60 billion)
- University of Toronto (CAD 4.48 billion)
- Colgate University (USD 1.34 billion)