
University System of New Hampshire & University of New Hampshire Foundation: endowment and investment office
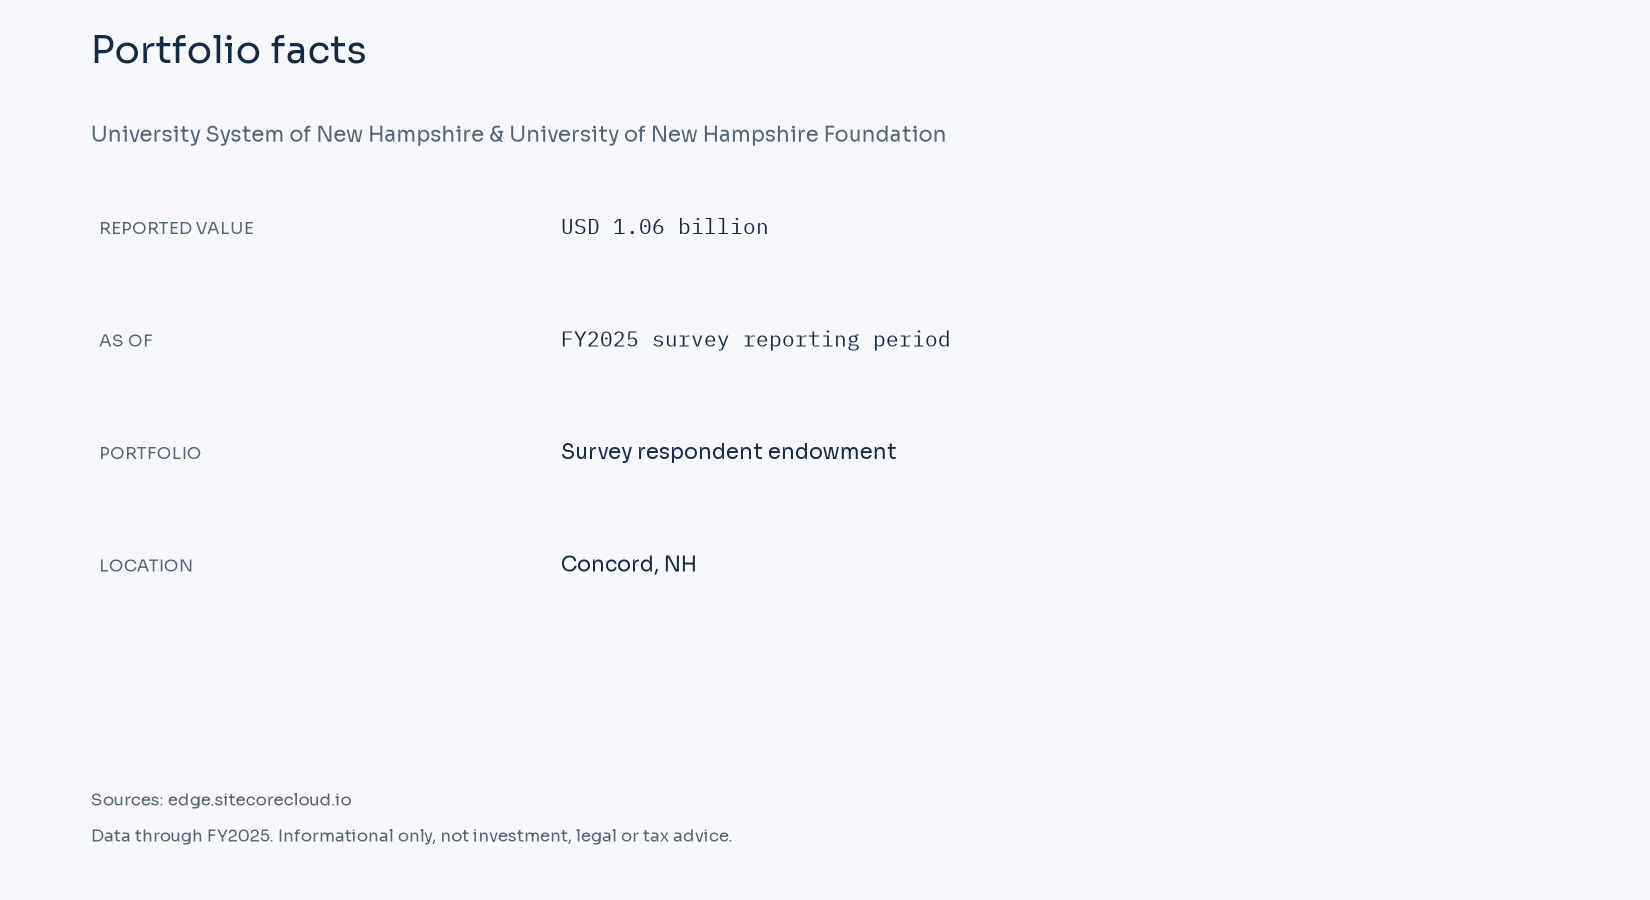
The FY2025 NACUBO table lists University System of New Hampshire & University of New Hampshire Foundation at USD 1.06 billion in respondent endowment assets. Balance source
USNH's FY2025 annual report separates its own investment pool and trusts from the University of New Hampshire Foundation pool and Keene Endowment Association pool. It reports approximately $44 million of endowment and trust distributions, including approximately $28 million from USNH, $15 million from UNHF and $873,000 from KEA. The rounded components do not need to equal the rounded total exactly. Official report
Key facts
- Reported value
- USD 1.06 billion
- As of
- FY2025 survey reporting period
- Portfolio
- Survey respondent endowment
- Location
- Concord, NH
Endowment size and reporting scope
The survey's respondent name determines the scope of the historical comparison. A campus and its supporting foundation can submit a combined amount or appear under separate names. Gifts remain subject to their terms even when the investments are pooled. The wider institution also owns assets used for its operations. Those operating assets are not automatically part of a permanent endowment or its investment portfolio. Survey scope and definitions
| Fiscal year | Survey endowment, USD millions |
|---|---|
| FY2016 | 651.335 |
| FY2017 | 726.365 |
| FY2018 | 776.795 |
| FY2019 | 803.867 |
| FY2020 | 798.695 |
| FY2021 | 995.886 |
| FY2022 | 856.545 |
| FY2023 | 905.968 |
| FY2024 | 981.482 |
| FY2025 | 1,062.953 |
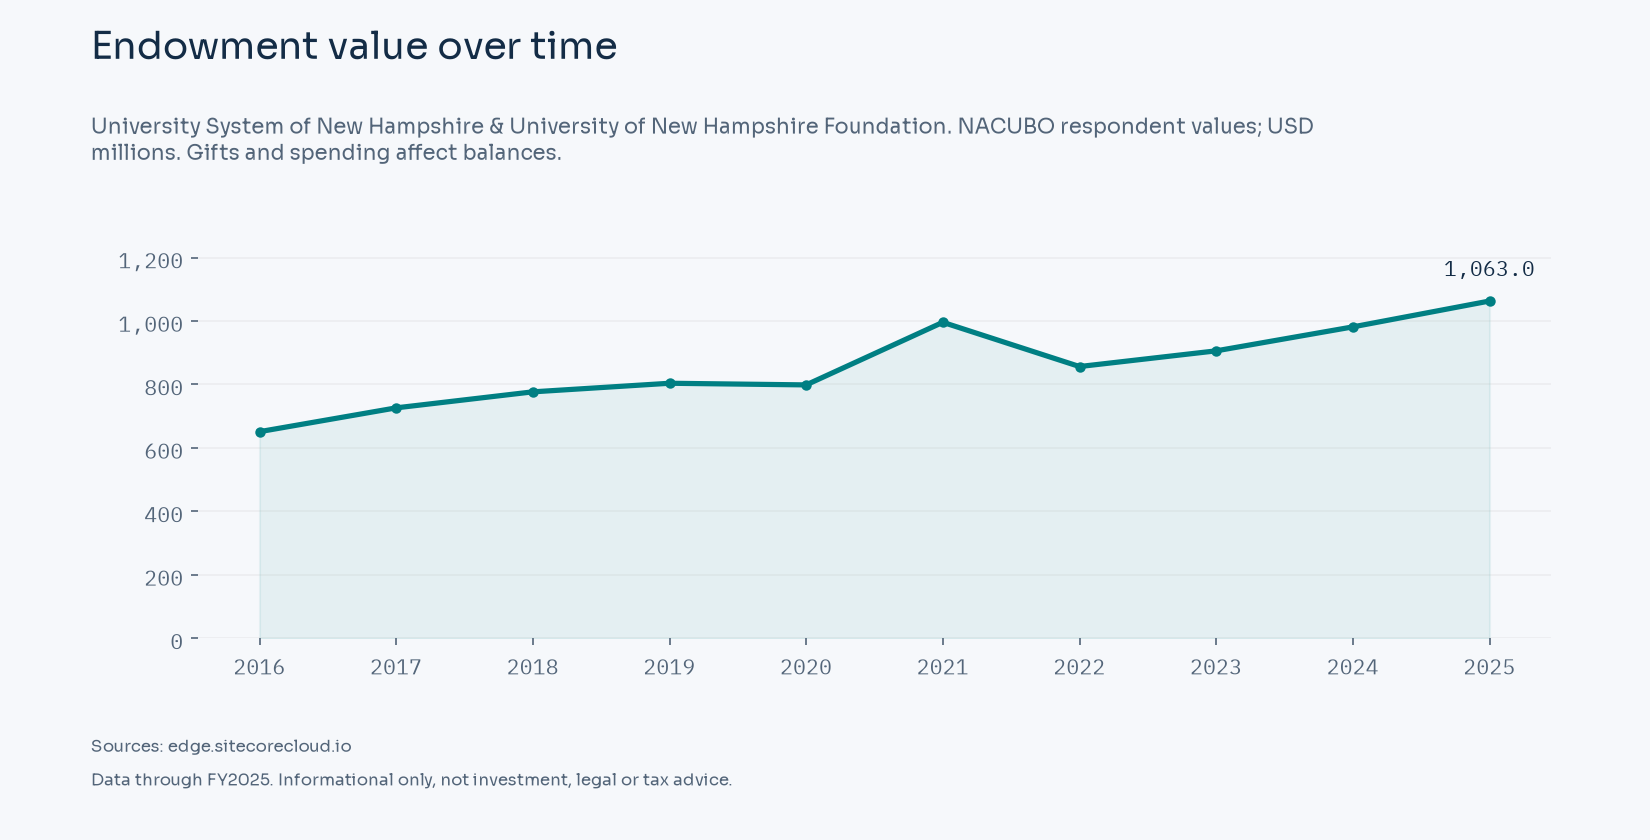
The FY2025 survey value for University System of New Hampshire & University of New Hampshire Foundation is USD 1,062.953 million, compared with USD 981.482 million for FY2024. The USD 81.471 million movement is 8.30% of the earlier balance. It includes changes in investments as well as additions and distributions. NACUBO explicitly distinguishes this change in market value from an investment rate of return. FY2025 respondent values and definitions
The available history begins in FY2016 at USD 651.335 million and ends in FY2025 at USD 1,062.953 million. The change across those observations is USD 411.618 million. The smallest reported balance in the displayed series is USD 651.335 million in FY2016; the largest is USD 1,062.953 million in FY2025. These are closing asset values. They do not show how much of a year's movement came from new gifts, spending or investment results. NACUBO historical workbook
Spending policy and payout
The annual report's approximately $44 million of distributions includes endowments and trusts across multiple reporting components. USNH holds some quasi-endowment funds that affect distribution ratios. The combined support amount is kept separate from a pure foundation-only payout. Spending disclosure
Annual support depends on both spending authority and investment liquidity. A formula determines the permitted draw, while investment redemptions and cash reserves provide the money. Private-fund capital calls and redemption limits affect timing. A closing market value does not measure those near-term demands, and an accounting appropriation does not identify every department's expenditure date. Spending measures
Governance and investment office
The annual report identifies the system and foundation pools separately. Trustees and affiliated foundation boards have their respective reporting responsibilities. A combined survey balance supports size comparison while individual pool policies and financial statements explain the legal scope. Investment governance
Federal excise tax on investment income
Public Law 119-21 changed Section 4968 for tax years beginning after December 31, 2025. Applicable private institutions must have at least 3,000 tuition-paying students in the preceding tax year, with more than half located in the United States, and student-adjusted endowment of at least $500,000. The rates are 1.4% from $500,000 through $750,000 per student, 4% above $750,000 through $2 million, and 8% above $2 million. Enacted law, Section 70415 These rates apply to net investment income, using the law's prior-year asset and student-count definitions.
Section 4968 excludes state colleges and universities described in Section 511(a)(2)(B). Supporting foundations retain their own legal and filing identities, with related-organization rules read alongside the public-university exclusion. A foundation's public endowment value does not, by itself, assign it a private-college tax tier.
FY2025 size-band comparison
The FY2025 survey value of USD 1,062.953 million places this respondent in the $1B to $5B band. The published band contains 125 respondents and USD 268.0 billion of aggregate assets. Its average five-year annualized net return is 10.8%, and its ten-year average is 8.0%. The size classification follows the survey-year balance even where an official disclosure on this page uses a later year or a different portfolio scope. NCSE size groups NCSE average net returns
| NCSE measure | FY2025 average |
|---|---|
| One-year net return | 11% |
| Five-year annualized net return | 10.8% |
| Ten-year annualized net return | 8.0% |
| Effective spending rate | 4.5% |
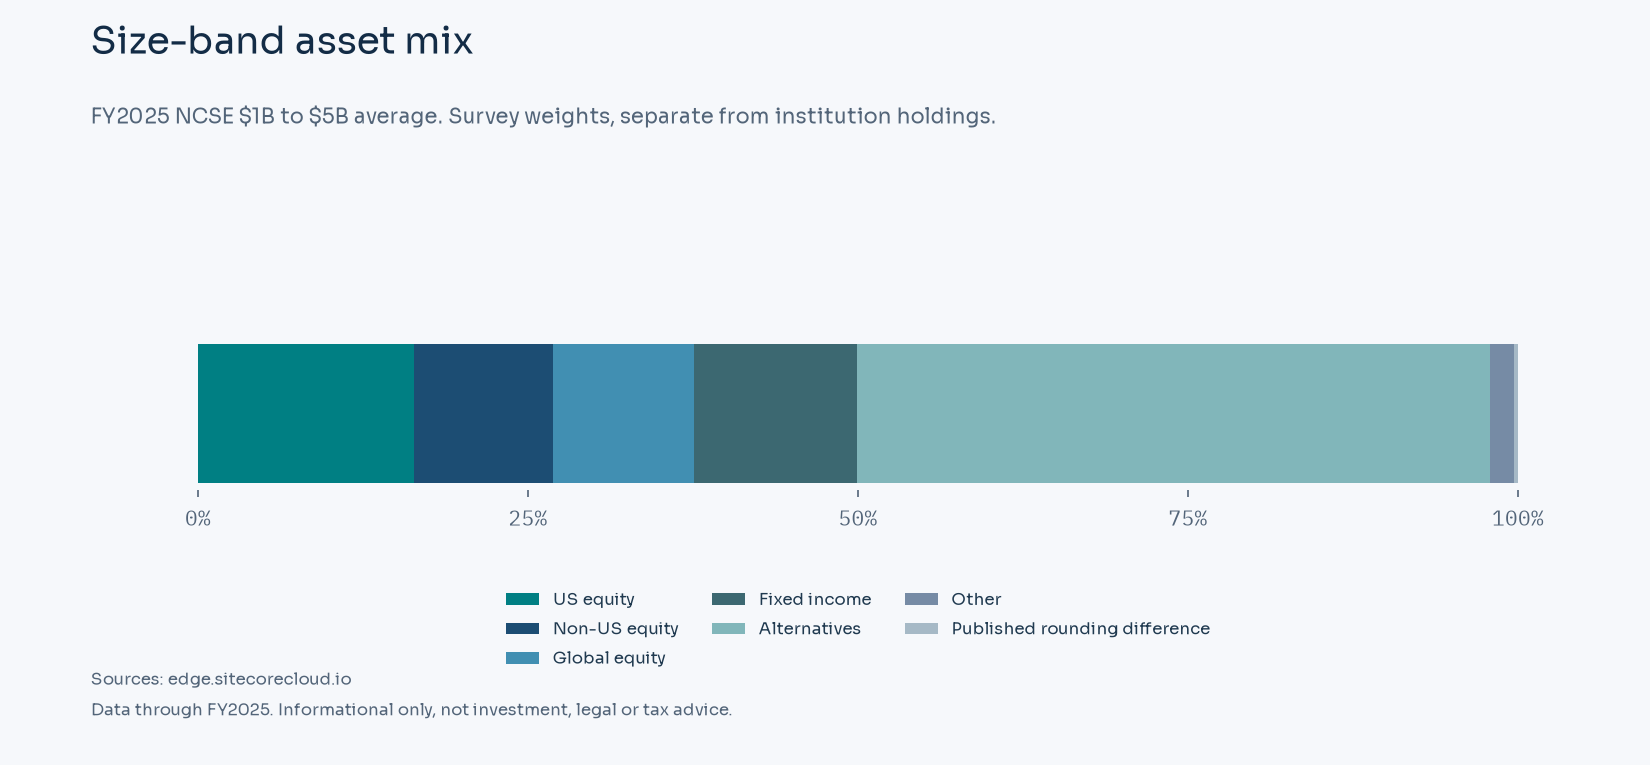
The peer mix describes average reported exposures within one size band. It does not reveal individual securities or the availability of cash at a particular institution. Respondents can also use different policy benchmarks. NCSE returns are net of external management fees and expenses for periods ending June 30, 2025; those periods and fee labels govern any numerical return comparison on this page. NCSE allocation definitions
Public records and reporting dates
NACUBO's respondent is University System of New Hampshire & University of New Hampshire Foundation. Annual financial statements and any nonprofit return can cover a different legal entity or a wider group of resources. A university, a supporting foundation and an investment pool can each report its own assets. Total organizational assets also include resources outside the endowment, and the tax-return accounting period can differ from the survey's reporting year. Those distinctions govern how public records are compared. Respondent identity
Sources
- https://edge.sitecorecloud.io/nacubo1-nacubo-prd-dc8b/media/Nacubo/Documents/EndowmentFiles/2025-NCSE-Endowment-Market-Values-for-US-and-Canadian-Institutions-FINAL.xlsx
- https://www.usnh.edu/sites/default/files/media/2025-10/2025-annual-report.pdf
- https://edge.sitecorecloud.io/nacubo1-nacubo-prd-dc8b/media/Nacubo/Documents/research/Final-Endowment-Market-Values--2023-to-1974-Revised.xlsx
- https://edge.sitecorecloud.io/nacubo1-nacubo-prd-dc8b/media/Nacubo/Documents/EndowmentFiles/2025-NCSE-Public-Tables--Spending-Rates-FINAL.pdf
- https://www.congress.gov/119/plaws/publ21/PLAW-119publ21.pdf
- https://edge.sitecorecloud.io/nacubo1-nacubo-prd-dc8b/media/Nacubo/Documents/EndowmentFiles/2025-NCSE-Public-Tables--Number-of-NCSE-Participants-FINAL.pdf
- https://edge.sitecorecloud.io/nacubo1-nacubo-prd-dc8b/media/Nacubo/Documents/EndowmentFiles/2025-NCSE-Public-Tables--10-Year-Returns-by-Size-and-Type-FINAL.pdf
- https://edge.sitecorecloud.io/nacubo1-nacubo-prd-dc8b/media/Nacubo/Documents/EndowmentFiles/2025-NCSE-Public-Tables--Summary-Asset-Allocations-FINAL.pdf
Related profiles
- University of Louisville Foundation (USD 1.07 billion)
- Temple University (USD 1.28 billion)
- Miami University (Nearly USD 1.30 billion)
- The University of Texas Health Science Center at Houston (USD 1.10 billion)
- University of California Irvine Foundation (USD 1.03 billion)
- Florida State University Foundation Inc. (USD 1.11 billion)