
Oswego University Foundation Inc.: endowment and investment office
Oswego University Foundation Inc. reports USD 80.9 million in endowment and planned-gift assets, rounded for June 30, 2025. Balance source
Oswego University Foundation's endowment information gives approximately $80.9 million in endowment and planned-gift assets at June 30, 2025. The page describes more than 829 individual funds and says more than 62% are designated for student scholarships. Its February 27, 2026 performance report supplies one-, five- and ten-year returns ended June 30, 2025. Planned-gift assets and the pooled endowment retain the source's separate labels. Official report
Key facts
- Reported value
- USD 80.9 million
- As of
- June 30, 2025
- Portfolio
- Endowment and planned-gift assets, rounded
- Location
- Oswego, NY
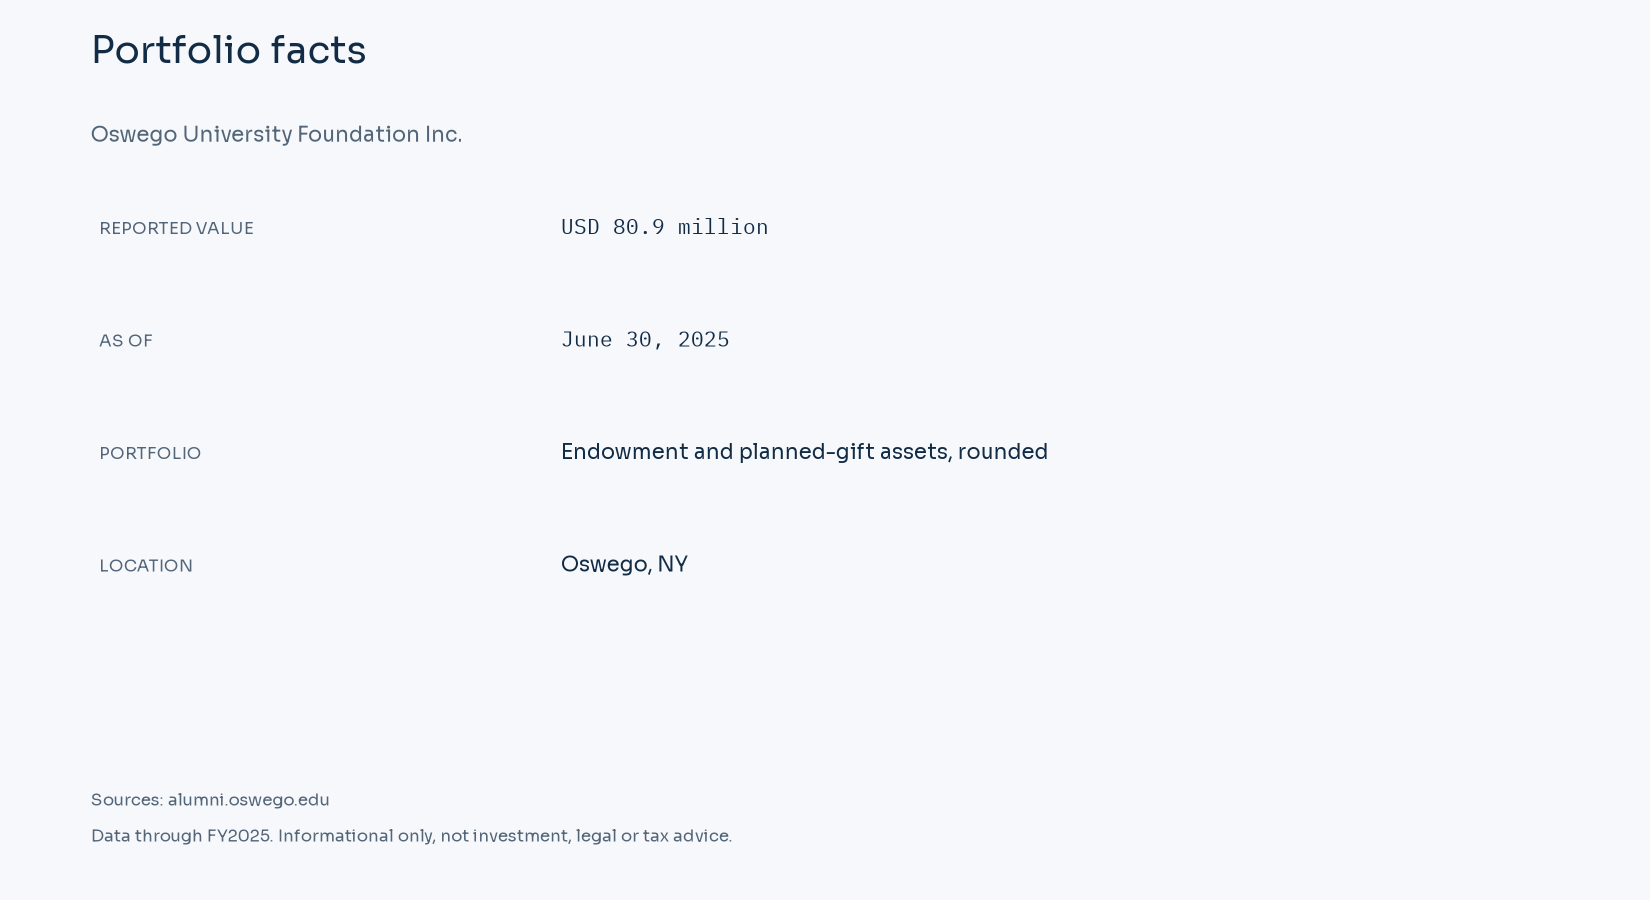
Endowment size and reporting scope
NACUBO places Oswego University Foundation Inc. in NY and reports USD 80.916 million in FY2025. The respondent's name defines the unit being compared across the survey columns. A campus, supporting foundation and investment pool can each publish financial information, and their totals can differ. Permanent gifts and board-designated resources also have different spending permissions. The balance therefore describes the reported assets at a date, with no assumption that all of them are available for general operations. Survey scope and definitions
| Fiscal year | Survey endowment, USD millions |
|---|---|
| FY2016 | 29.275 |
| FY2017 | 33.616 |
| FY2018 | 37.418 |
| FY2019 | 41.850 |
| FY2020 | 44.064 |
| FY2021 | 56.680 |
| FY2022 | 53.910 |
| FY2023 | 61.951 |
| FY2024 | 71.787 |
| FY2025 | 80.916 |
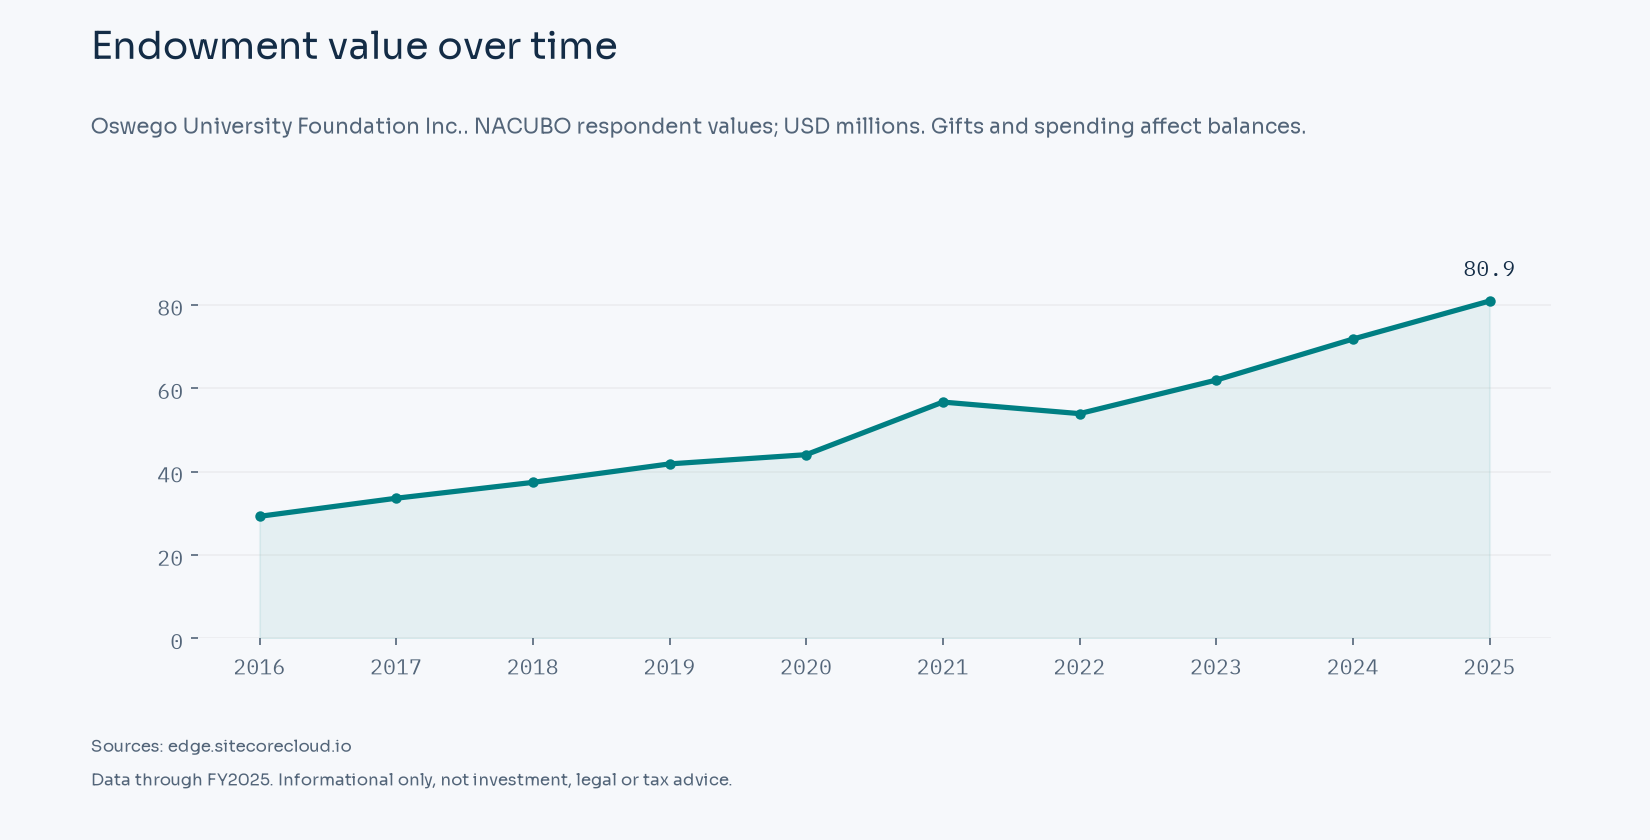
The FY2025 survey value for Oswego University Foundation Inc. is USD 80.916 million, compared with USD 71.787 million for FY2024. The reported balance rose by USD 9.129 million, or 12.72%, from FY2024. It includes changes in investments as well as additions and distributions. NACUBO explicitly distinguishes this change in market value from an investment rate of return. FY2025 respondent values and definitions
The available history begins in FY2016 at USD 29.275 million and ends in FY2025 at USD 80.916 million. The change across those observations is USD 51.641 million. The smallest reported balance in the displayed series is USD 29.275 million in FY2016; the largest is USD 80.916 million in FY2025. The displayed observations are year-end asset balances. NACUBO historical workbook
Investment returns
| Portfolio | Period end | Horizon | Reported return |
|---|---|---|---|
| Pooled endowment | June 30, 2025 | 1 year | 11.6% |
| Pooled endowment | June 30, 2025 | 5 years, annualized | 11.2% |
| Pooled endowment | June 30, 2025 | 10 years, annualized | 9% |
A trailing multi-year return is an annualized compound result over the period shown. The one-year figure covers the final year. These periods overlap, so their returns are not added. A published dollar investment gain can reflect accounting categories and cash flows that differ from the percentage performance calculation. Return definitions and reporting basis
Spending policy and payout
Oswego uses a 20-quarter rolling-average account balance with March 31 as the final measurement date. Its Board of Directors approves the spending rate annually. A distribution remains tied to its endowed account's purpose. The official policy explanation does not assign a numerical rate to the current year, so no percentage is inferred from the endowment's closing value. Spending disclosure
A distribution from an endowed account remains subject to that account's purpose. For Oswego University Foundation Inc., the FY2025 asset figure alone cannot establish either the next approved draw or the part available for unrestricted operations. A policy based on several earlier valuations can produce a different dollar appropriation from a percentage of today's closing balance. The survey group's effective rate has its own measurement basis. Spending measures
Governance and investment office
The Oswego University Foundation Investment Committee oversees the endowment. Its unitized pool calculates a market value per share monthly, with new gifts purchasing shares at the prior month-end value. The Board of Directors approves annual spending rates. Its current policy page describes committee responsibilities without naming an investment-office head. Investment governance
Federal excise tax on investment income
Public Law 119-21 changed Section 4968 for tax years beginning after December 31, 2025. Applicable private institutions must have at least 3,000 tuition-paying students in the preceding tax year, with more than half located in the United States, and student-adjusted endowment of at least $500,000. The rates are 1.4% from $500,000 through $750,000 per student, 4% above $750,000 through $2 million, and 8% above $2 million. Enacted law, Section 70415
Section 4968 excludes state colleges and universities described in Section 511(a)(2)(B). Supporting foundations retain their own legal and filing identities, with related-organization rules read alongside the public-university exclusion. A foundation's public endowment value does not, by itself, assign it a private-college tax tier.
Section 4968 taxes net investment income; the spending policy governs distributions.
FY2025 size-band comparison
The FY2025 survey value of USD 80.916 million places this respondent in the $50M to $100M band. The published band contains 96 respondents and USD 7.2 billion of aggregate assets. Its average five-year annualized net return is 10.1%, and its ten-year average is 7.5%. NCSE size groups NCSE average net returns
| NCSE measure | FY2025 average |
|---|---|
| One-year net return | 11.1% |
| Five-year annualized net return | 10.1% |
| Ten-year annualized net return | 7.5% |
| Effective spending rate | 5.5% |
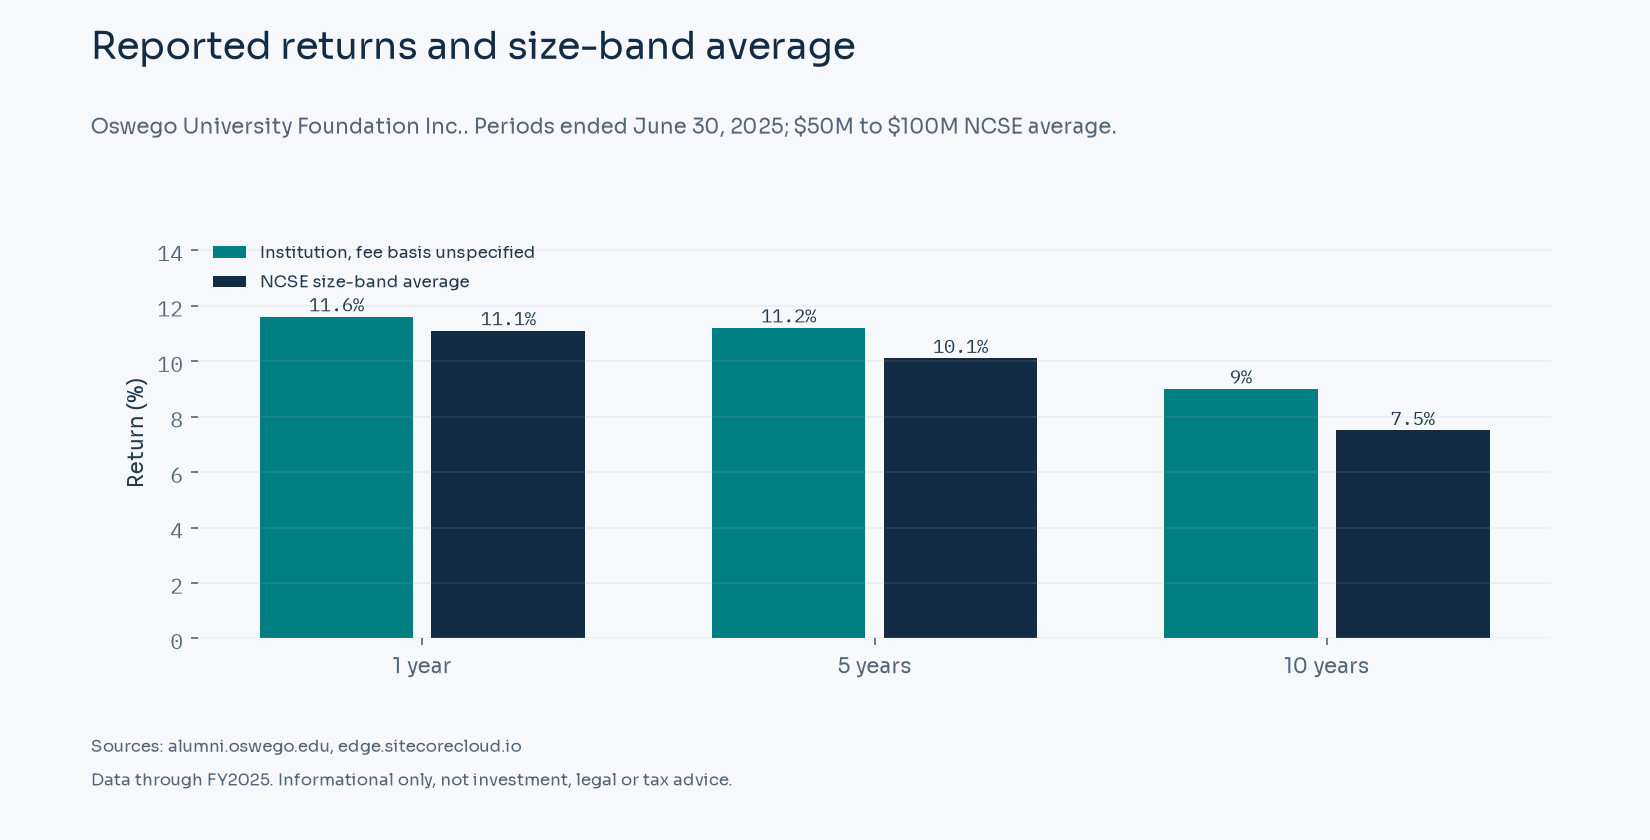
Institution fee treatment is unspecified in the cited performance disclosure. NCSE reports net of external management fees and expenses. These fee bases can affect the comparison.
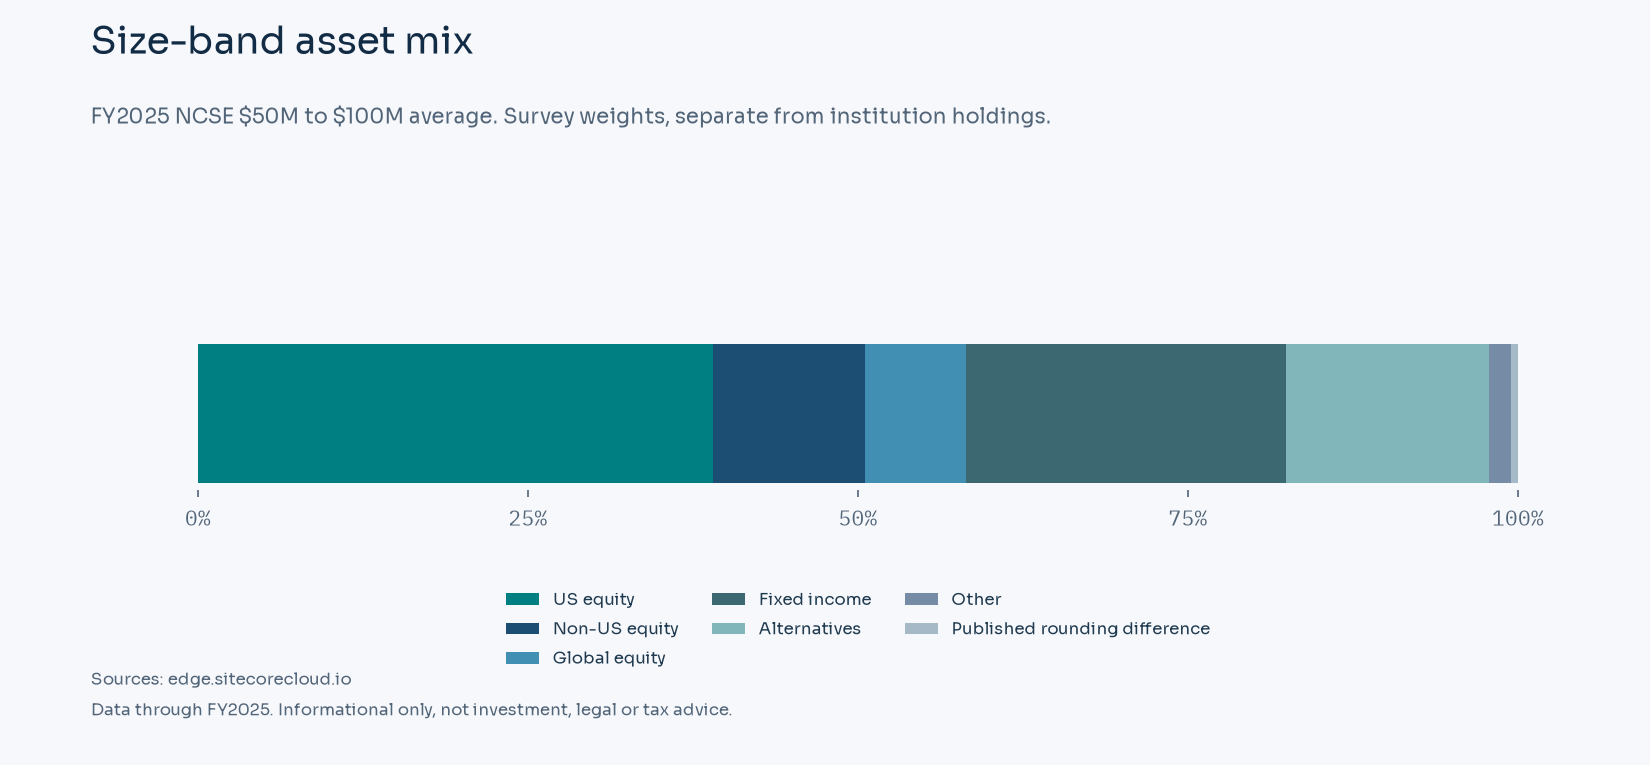
The peer mix describes average reported exposures within one size band. It does not reveal individual securities or the availability of cash at a particular institution. Respondents can also use different policy benchmarks. NCSE returns are net of external management fees and expenses for periods ending June 30, 2025; those periods and fee labels govern any numerical return comparison on this page. NCSE allocation definitions
Public records and reporting dates
NACUBO's respondent is Oswego University Foundation Inc.. Annual financial statements and any nonprofit return can cover a different legal entity or a wider group of resources. A university, a supporting foundation and an investment pool can each report its own assets. Total organizational assets also include resources outside the endowment, and the tax-return accounting period can differ from the survey's reporting year. Those distinctions govern how public records are compared. Respondent identity
Sources
- https://alumni.oswego.edu/endowment
- https://edge.sitecorecloud.io/nacubo1-nacubo-prd-dc8b/media/Nacubo/Documents/EndowmentFiles/2025-NCSE-Endowment-Market-Values-for-US-and-Canadian-Institutions-FINAL.xlsx
- https://edge.sitecorecloud.io/nacubo1-nacubo-prd-dc8b/media/Nacubo/Documents/research/Final-Endowment-Market-Values--2023-to-1974-Revised.xlsx
- https://alumni.oswego.edu/?sid=1552&gid=1&pgid=5767&cc=1
- https://edge.sitecorecloud.io/nacubo1-nacubo-prd-dc8b/media/Nacubo/Documents/EndowmentFiles/2025-NCSE-Public-Tables--Spending-Rates-FINAL.pdf
- https://www.congress.gov/119/plaws/publ21/PLAW-119publ21.pdf
- https://edge.sitecorecloud.io/nacubo1-nacubo-prd-dc8b/media/Nacubo/Documents/EndowmentFiles/2025-NCSE-Public-Tables--Number-of-NCSE-Participants-FINAL.pdf
- https://edge.sitecorecloud.io/nacubo1-nacubo-prd-dc8b/media/Nacubo/Documents/EndowmentFiles/2025-NCSE-Public-Tables--10-Year-Returns-by-Size-and-Type-FINAL.pdf
- https://edge.sitecorecloud.io/nacubo1-nacubo-prd-dc8b/media/Nacubo/Documents/EndowmentFiles/2025-NCSE-Public-Tables--Summary-Asset-Allocations-FINAL.pdf
Related profiles
- University of Wisconsin-Eau Claire Foundation Inc. (USD 79.5 million)
- Clark Community College District No. 14 Foundation (USD 83.3 million)
- Radford University Foundation (USD 78.8 million)
- SUNY Cortland (USD 76.9 million)
- Shippensburg University of Pennsylvania (USD 76.7 million)
- Foundation For California Community Colleges (USD 49.7 million)